ManageEngine ServiceDesk Plus MSP Integration
I built an integration between LogicMonitor and ServiceDesk Plus, thought I would share it with you
Building Integration between LogicMonitor and ManageEngine ServiceDesk Plus MSP
Integration between LogicMonitor and ManageEngine ServiceDesk Plus MSP is not a pre-built integration, the following will instruct you on building this integration.
This integration will be a basic integration and will do the following things
1. Create a new ticket when an alert is kicked off
2. When an alert is acknowledged a note will be placed in the ticket
3. Any Escalation or De-escalation of the alert will be noted in the ticket
4. When an alert is cleared it will resolve the ticket
Prepping ServiceDesk Plus MSP
First you want to create a requestor account in the account that you are placing the ticket in, you will be using this as who is submitting the ticket
Next create a new technician account and give them the rights to handle tickets in the site you are placing the alert tickets.
At the bottom of the technician creation screen there is a section called API key details, click the Generate link to create an API Key. Remember this key as you will need it later and you cannot see the key again. If you lose it you will need to Generate a new one and replace it where ever you used the old one.
Creating the Integration
The following will explain on how to set up a base integration and you can customize it to your liking
1. Login into LogicMonitor and on the left hand side click Settings then click on Integrations
2. Click Add at the top then Click on Custom HTTP Delivery
3. Type in a Name and select “Use different URLs or data formats to notify on various alert activity”
4. Next, we are going to setup each alert activity
a. First the New Alerts
i. Click the Plus Button to add a new Alert Status
ii. Under HTTP Method select HTTP Post
iii. For URL select either http or https and type (replace exampleurl.com with the url of your service desk) exampleurl.com/sdpapi/request
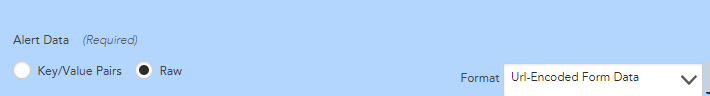
iv. Under Alert Data select the RAW option
v. For Format select Url-Encoded Form Data
vi. For the actual alert data, you place the data you want to send to service desk, here is a starter: (replace 555 with the Technician key you created)
format=XML&TECHNICIAN_KEY=555&INPUT_DATA=
<operation>
<details>
<subject>##LEVEL## - ##HOST## ##INSTANCE##</subject>
<description>Message ##MESSAGE##></description>
<requester>Logic Monitor</requester>
<category>Monitoring</category>
<subcategory>Infrastructure</subcategory>
<item>LogicMonitor</item>
<technician>Administrator</technician>
<mode>Automated</mode>
<site>RES</site>
<account>RES</account>
</details>
</operation>
*You will need to also replace the Field values to what you need to send. Details on these can be found on ManageEngine’s API Page
vii. Click Save
b. Next we will add the Acknowledged Status, this will add a note to the ticket when the Alert is acknowledged in LogicMonitor
i. Click the Plus Button to add a new Alert Status
ii. Select Acknowledged
iii. Under HTTP Method select HTTP Post
iv. For URL select either http or https and type (replace exampleurl.com with the url of your service desk) exampleurl.com/sdpapi/request/##EXTERNALTICKETID##/notes
v. Under Alert Data select the RAW option
vi. For Format select Url-Encoded Form Data
vii. For the actual alert data you place the data you want to send to service desk, here is a starter: (replace 555 with the Technician key you created)
format=XML&TECHNICIAN_KEY=555&INPUT_DATA=
<operation>
<details>
<notes>
<note>
<notestext>Alert Acknowledged</notestext>
</note>
</notes>
</details>
</operation>
viii. Click Save
c. Next will be the Escalated Status, this will place a note in the Ticket on the Escalation of the ticket
i. Click the Plus Button to add a new Alert Status
ii. Select Escalated
iii. Under HTTP Method select HTTP Post
iv. For URL select either http or https and type (replace exampleurl.com with the url of your service desk) exampleurl.com/sdpapi/request/##EXTERNALTICKETID##/notes
v. Under Alert Data select the RAW option
vi. For Format select Url-Encoded Form Data
vii. For the actual alert data you place the data you want to send to service desk, here is a starter: (replace 555 with the Technician key you created)
format=XML&TECHNICIAN_KEY=555&INPUT_DATA=
<operation>
<details>
<notes>
<note>
<notestext>Alert Escalated/De-escalated:Host: ##HOST## Datasource: ##DATASOURCE## Datapoint: ##DATAPOINT## Level: ##LEVEL## Start: ##START## Duration: ##DURATION## Value: ##VALUE## Reason: ##DATAPOINT## ##THRESHOLD##</notestext>
</note>
</notes>
</details>
</operation>
viii. Click Save
d. Next we will tell ServiceDesk to resolve the ticket when the Alert is Cleared
i. Click the Plus Button to add a new Alert Status
ii. Select Cleared
iii. Under HTTP Method select HTTP Post
iv. For URL select either http or https and type (replace exampleurl.com with the url of your service desk) exampleurl.com/sdpapi/request/##EXTERNALTICKETID##
v. Under Alert Data select the RAW option
vi. For Format select Url-Encoded Form Data
vii. For the actual alert replace the data you want to send to service desk, here is a starter: (replace 555 with the Technician key you created)
format=XML&TECHNICIAN_KEY=555&INPUT_DATA=
<operation>
<details>
<resolution>test</resolution>
<status>resolved</status>
</details>
</operation>
viii. Click Save
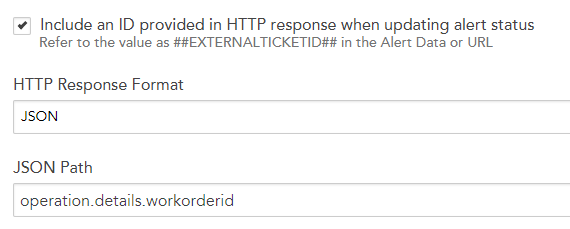
5. Click the Check box for “Include an ID provided in HTTP response when updating alert status”
6. For HTTP Response Format Choose XML
7. For the Xpath use: /operation[@name="ADD_REQUEST"]/details/workorderid/text()