Neophyte
How to find Average value of a metric/field for a particular time range
Hi,
I am trying to collect the average/max value of a field or metric only for a particular time range which we choose. I am unaware through which kind of Widget I can show the average/max value of a particular time period as a single value.
I tried using Gauge & Big Number Widget to show my single average value for a specific time period. But the problems are as follows:
1. Big Number Widget - will show only the single value but it does not have any type of aggregation function (Min, max, avg)
2. Gauge widget - Contains Aggregation function to select. But not sure whether it is aggregating the field values according to the time range we select. Because everytime when the Dashboard/Widget is refreshed according to the Refresh Frequency, it is showing different values. For example, if I select the time range from March 1st to March 31st, then aggregate values should be same as it is not the real-time occurence.
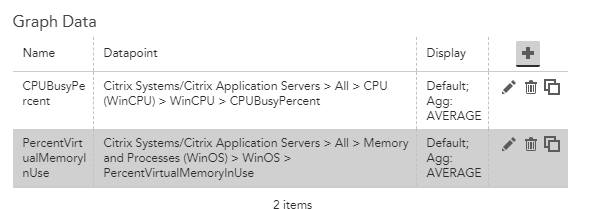
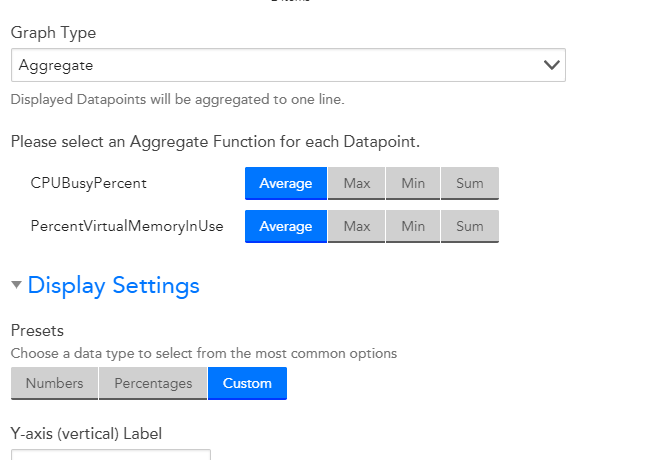
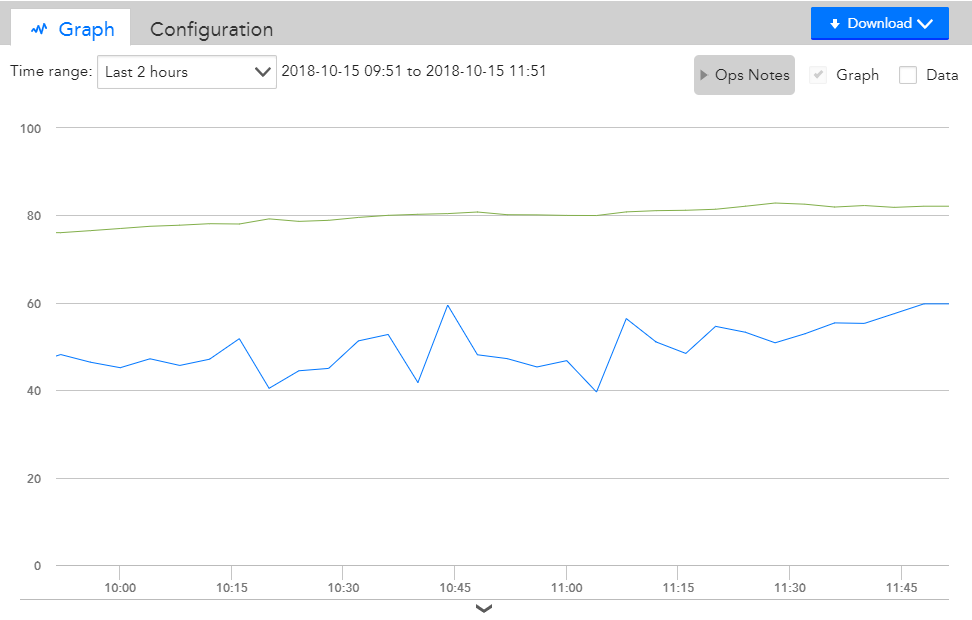
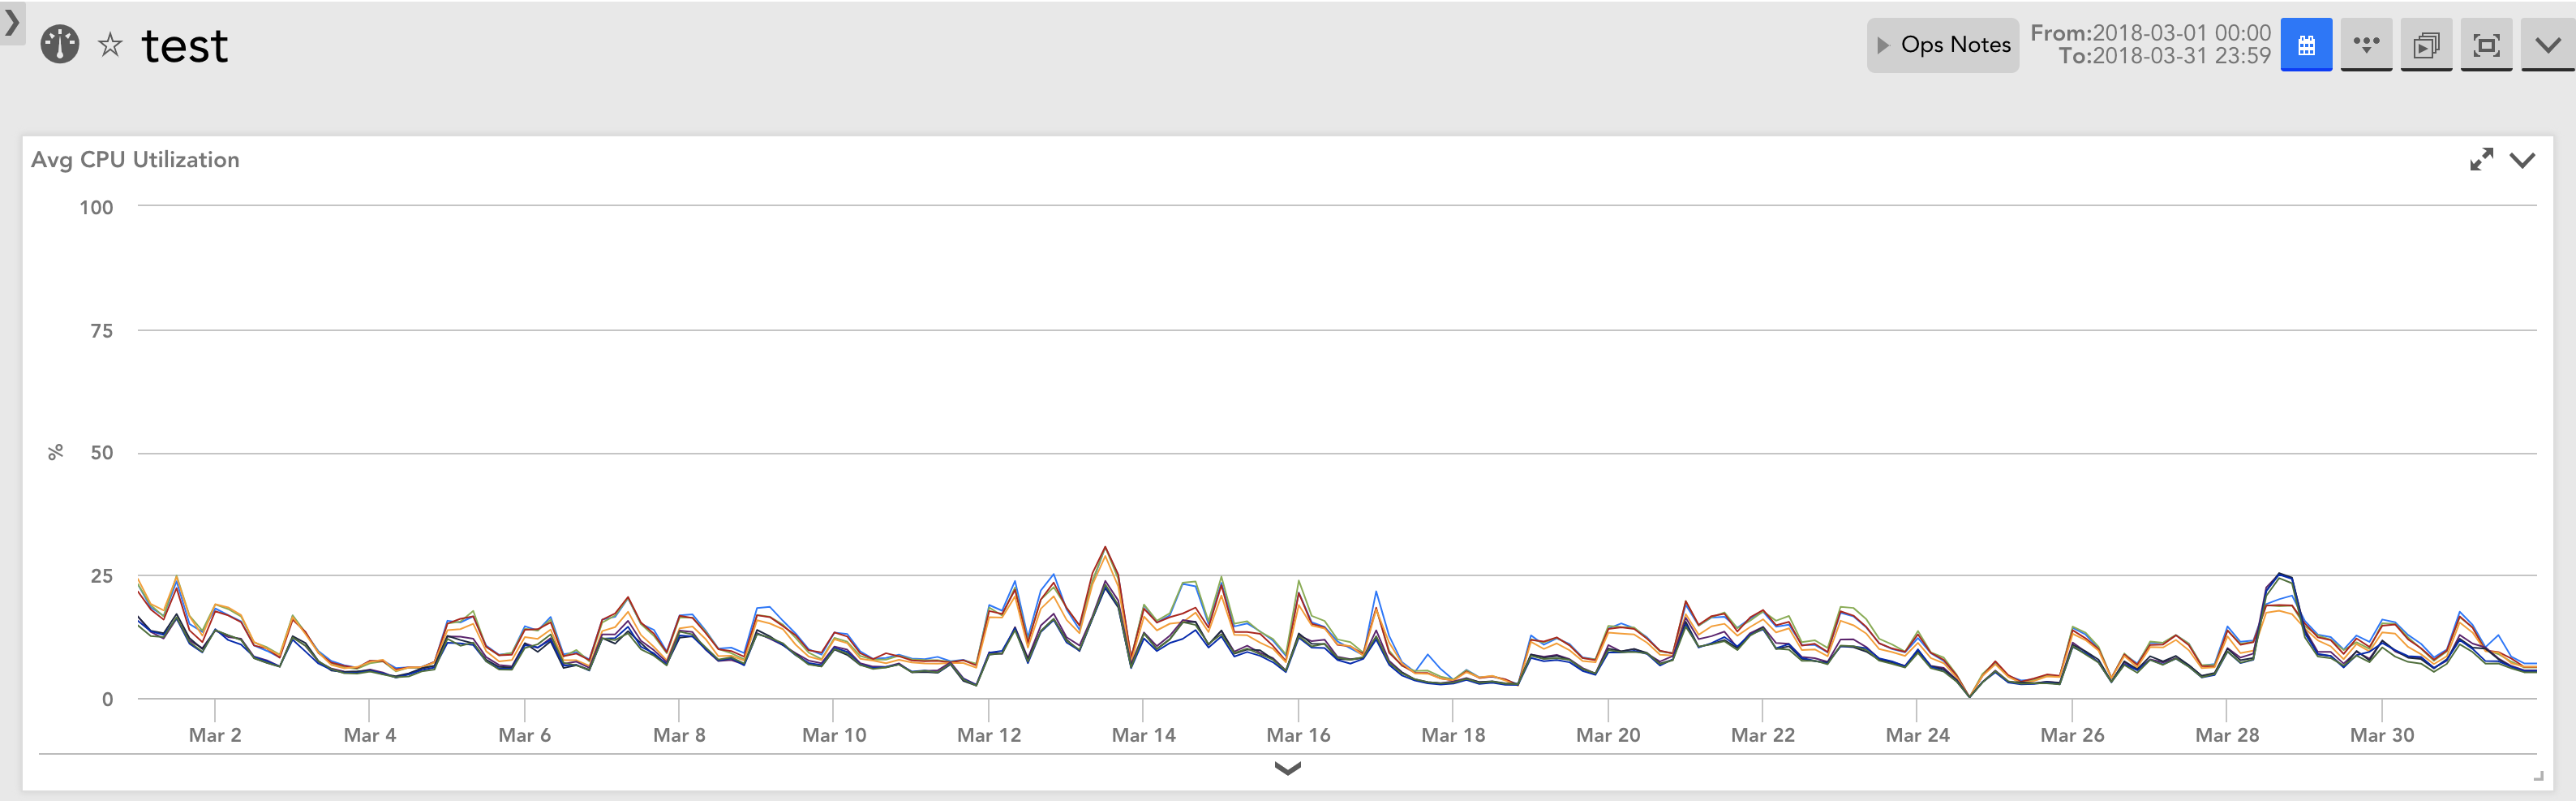
I tried with Graph Widget (refer the attached screenshot Avg_metric_CPU), it is providing me the proper values of that time. But I need the data to be shown as single average value, monthly-wise.
Could anyone please help me on this.
Hi @Archana, I think we do what you're looking for, but the feature is sort of hidden.
Open the expanded graph, then expand the instances pane at the bottom.
On the right side of the instance pane, there's another downward pointing arrow. If you click on that arrow and select "Show Boundaries' you'll see min/max/avg for each instance for the selected time range.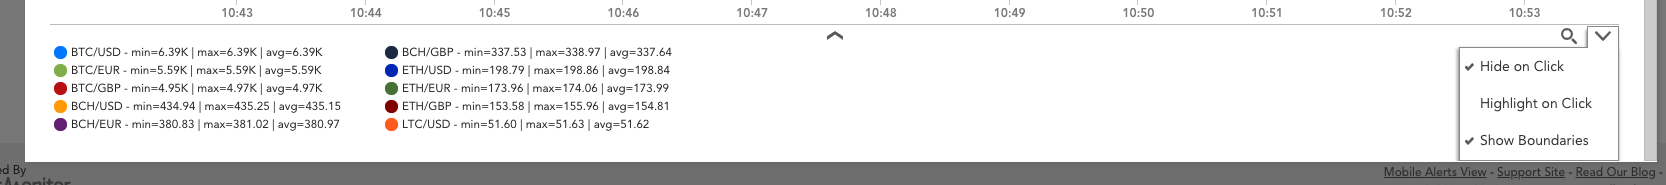
You may have to aggregate instances into one to get the average across multiple instances.