Keimond Neophyte
8 years agoNeophyteDisplaying aggregate data per X time
Example, we have a graph showing the current number of connected users..
I have another datapoint that derives those values so I can see the number of new users that connected between polls.
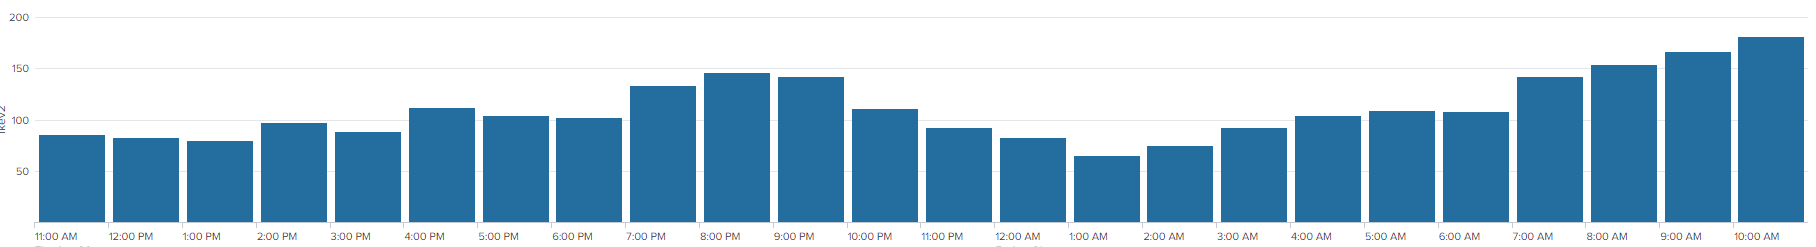
I want to see a bar graph over x time ( like 24 hours ) and see the total number of new connections per x time ( like 1 hour )
Here's a decent example..
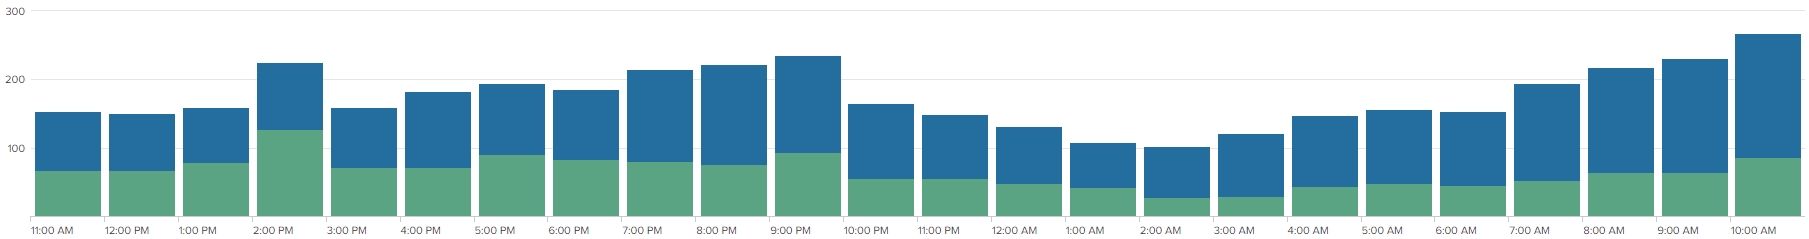
Or maybe I want to stack the graph with other datapoints showing connected users per protocol or something...
Thanks!
David Klein