 Employee
Common issues : High CPU usage on the Collector
This article provides information on High CPU usage on the Collector .
(1) General Best Practices
(a) First and foremost we advise our customers to be on latest General Release Collectors (unless advised not to) . Further information all the Collector information could be retrieved on the link below :
https://www.logicmonitor.com/support/settings/collectors/collector-versions/
Also on the release notes of each newer Collector version we will indicate if we have fixed any known issues :
https://www.logicmonitor.com/releasenotes/
(b) Please also view our Collector Capacity guide to get a full overview on how to optimise the Collector Performances :
https://www.logicmonitor.com/support/settings/collectors/collector-capacity/
(c) When providing information on High CPU usage it would be useful if you can advise if the High CPU usage is all the time or a certain timeframe only (also if any environmental changes were done on physical machine that may have triggered this issue). Please do advise also if this occurred after adding newer devices on the collector or if this issue occurs after applying a certain version of the Collector.
(2) Common Issues
On this topic i will go through some of the common issues which have been fixed or worked upon by our Development Teams :
(A) Check if the CPU is used by the Collector (Java Process) or SBproxy or other processes.
(i) To monitor Collector Java Process :
Use the datasource Collector JVM status to check the Collector (Java process) CPU usage (as shown below).

(ii) To monitor the SBProxy usage :
We can use the datasource : WinProcessStats.xml (for Windows collector / For Linux data source (this datasource is still being developed) .
(B) If the high CPU usage is caused by the Collector Java processes, below are some of the common causes :
(i) Collector java process using high CPU
How confirm if this the similar issue : In the Collector Wrapper Logs you are able to view this error message :
In our Collector wrapper.log, you can see a lot of logs like the below:
DataQueueConsumers$DataQueueConsumer.run:338] Un-expected exception - Must be BUG, fix this, CONTEXT=, EXCEPTION=The third long is not valid version - 0
java.lang.IllegalArgumentException: The third long is not valid version - 0
at com.santaba.agent.reporter2.queue.QueueItem$Header.deserialize(QueueItem.java:66)
at com.santaba.agent.reporter2.queue.impl.QueueItemSerializer.head(QueueItemSerializer.java:35)
This issue has been in Collector version EA 23.200
(ii) CPU load spikes on Linux Collectors
As shown in the image below the CPU usage of Collector Java process has a periodic CPU spike (on an hourly basis) .
This issue has been fixed on Collector version EA 23.026

(iii) Excessive CPU usage despite not having any devices running on it
In the collector wrapper.log, you can see similar logs as below :
[04-11 10:32:20.653 EDT] [MSG] [WARN] [pool-20-thread-1::sse.scheduler:sse.scheduler] [SSEChunkConnector.getStreamData:87] Failed to get SSEStreamData, CONTEXT=current=1491921140649(ms), timeout=10000, timeUnit=MILLISECONDS, EXCEPTION=null
java.util.concurrent.TimeoutException
at java.util.concurrent.FutureTask.get(FutureTask.java:205)
at com.logicmonitor.common.sse.connector.sseconnector.SSEChunkConnector.getStreamData(SSEChunkConnector.java:84)
at com.logicmonitor.common.sse.processor.ProcessWrapper.doHandshaking(ProcessWrapper.java:326)
at com.logicmonitor.common.sse.processor.ProcessorDb._addProcessWrapper(ProcessorDb.java:177)
at com.logicmonitor.common.sse.processor.ProcessorDb.nextReadyProcessor(ProcessorDb.java:110)
at com.logicmonitor.common.sse.scheduler.TaskScheduler$ScheduleTask.run(TaskScheduler.java:181)
at java.util.concurrent.Executors$RunnableAdapter.call(Executors.java:511)
at java.util.concurrent.FutureTask.run(FutureTask.java:266)
at java.util.concurrent.ThreadPoolExecutor.runWorker(ThreadPoolExecutor.java:1142)
at java.util.concurrent.ThreadPoolExecutor$Worker.run(ThreadPoolExecutor.java:617)
at java.lang.Thread.run(Thread.java:745)
This issue has been fixed on EA 24.085
(iv) SSE process stdout and stderr stream not consumed in Windows
Please note this issue occurs on only on Windows Collectors and the CPU usage of the Windows operating system has a stair-step shape as shown below.
This has been fixed in Collector EA 23.076

(v) Collector goes down intermittently on daily basis
In the Collector wrapper.logs, you can see similar log lines :
[12-21 13:10:48.661 PST] [MSG] [INFO] [pool-60-thread-1::heartbeat:check:4741] [Heartbeater._printStackTrace:265] Dumping HeartBeatTask stack, CONTEXT=startedAt=1482354646203, stack=
Thread-40 BLOCKED
java.io.PrintStream.println (PrintStream.java.805)
com.santaba.common.logger.Logger2$1.print (Logger2.java.65)
com.santaba.common.logger.Logger2._log (Logger2.java.380)
com.santaba.common.logger.Logger2._mesg (Logger2.java.284)
com.santaba.common.logger.LogMsg.info (LogMsg.java.15)
com.santaba.agent.util.Heartbeater$HeartBeatTask._run (Heartbeater.java.333)
com.santaba.agent.util.Heartbeater$HeartBeatTask.run (Heartbeater.java.311)
java.util.concurrent.Executors$RunnableAdapter.call (Executors.java.511)
java.util.concurrent.FutureTask.run (FutureTask.java.266)
java.util.concurrent.ThreadPoolExecutor.runWorker (ThreadPoolExecutor.java.1142)
java.util.concurrent.ThreadPoolExecutor$Worker.run (ThreadPoolExecutor.java.617)
java.lang.Thread.run (Thread.java.745)
[12-21 13:11:16.597 PST] [MSG] [INFO] [pool-60-thread-1::heartbeat:check:4742] [Heartbeater._printStackTrace:265] Dumping HeartBeatTask stack, CONTEXT=startedAt=1482354647068, stack=
Thread-46 RUNNABLE
java.io.PrintStream.println (PrintStream.java.805)
com.santaba.common.logger.Logger2$1.print (Logger2.java.65)
com.santaba.common.logger.Logger2._log (Logger2.java.380)
com.santaba.common.logger.Logger2._mesg (Logger2.java.284)
com.santaba.common.logger.LogMsg.info (LogMsg.java.15)
com.santaba.agent.util.Heartbeater$HeartBeatTask._run (Heartbeater.java.320)
com.santaba.agent.util.Heartbeater$HeartBeatTask.run (Heartbeater.java.311)
java.util.concurrent.Executors$RunnableAdapter.call (Executors.java.511)
java.util.concurrent.FutureTask.run (FutureTask.java.266)
gobler terminated ERROR 5296
java.util.concurrent.ThreadPoolExecutor.runWorker (ThreadPoolExecutor.java.1142)
java.util.concurrent.ThreadPoolExecutor$Worker.run (ThreadPoolExecutor.java.617)
java.lang.Thread.run (Thread.java.745)
This issue has now been fixed in Collector EA 22.228
(C) High CPU usage caused by SBProxy
(i) Collector CPU spikes until 99%
The poor performance of WMI or PDH data collection on some cases will cause too many retries will occur and this consumes a lot of CPU.
In the collector sbproxy.log, you can search the log string as shown below and you can see the retry times is nearly 100 per request and subsequently this will consume a lot of CPU.
,retry:
This is being investigated by our development team at this time and will be fixed in the near future .
(3) Steps to take when facing high CPU usage for Collector
(i) Ensure the collector has been added as a device and enabled for monitoring :
https://www.logicmonitor.com/support/settings/collectors/monitoring-your-collector/
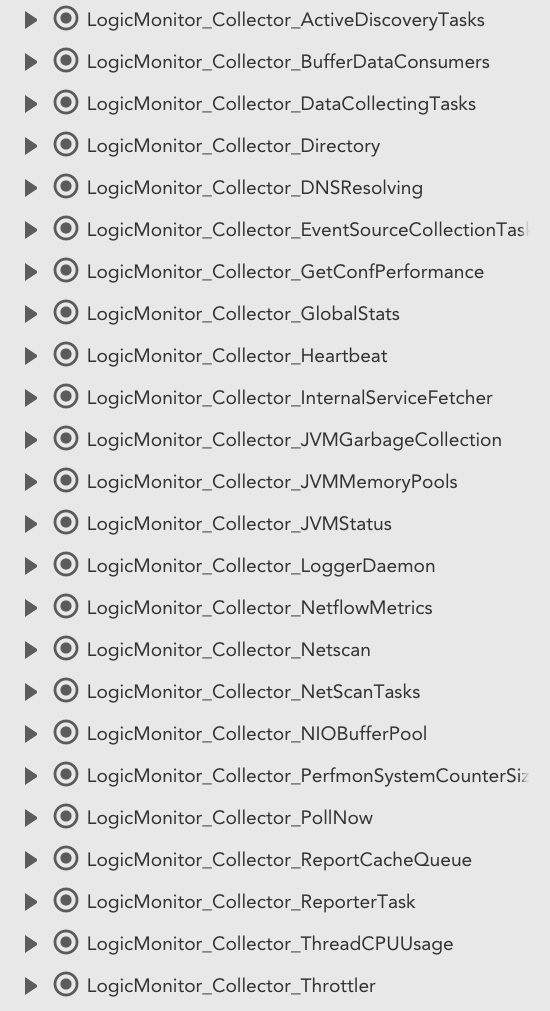
There are set of New Datasources for the Collector (LogicMonitor Collector Monitoring Suite - 24 DataSources) which as shown below and please ensure they have been updated in your portal and applied to your Collectors and also ensure the Linux CPU or Windows CPU datasources have been applied to the Collector :
(ii) Record a JFR (java flying record) in debug command window of the Collector :
this can done through this method :
// unlock commercial feature
!jcmd unlockCommercialFeatures
// start a jfr , in real troubleshooting case, should increase the duration a reasonable value.
!jcmd duration=1m delay=5s filename=test.jfr name=testjfr jfrStart
// stop a jfr
!jcmd name=testjfr jfrStop
// upload the jfr record
!uploadlog test.jfr
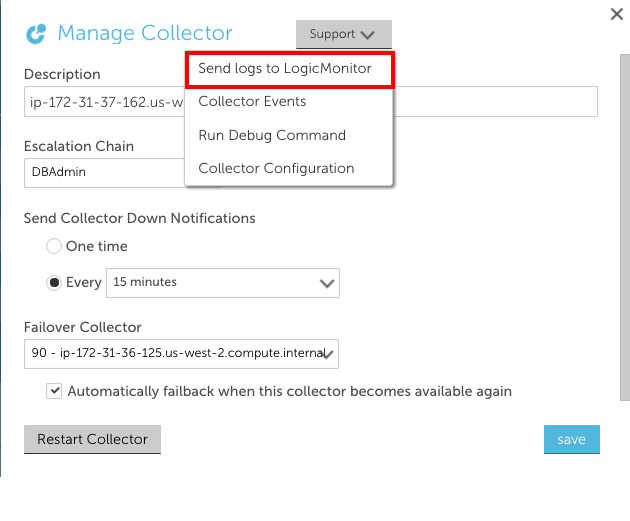
(iii) Upload the Collector Logs :
From the Manage dialog you can send your logs to LogicMonitor support. Select the manage gear icon for the desired collector and then select 'Send logs to LogicMonitor':
Credits: LogicMonitor Collector development team for providing valuable input in order to publish this article .