 Employee
Collector Basic Usage
Often times our Tech Support team encountered customer's Collector questions such as how to navigate, configure and where to find hints if the Collector is not behaving as it should, hence I am here to share some basic usage and tips and tricks for troubleshooting Collectors.
We will be covering 4 topics in this aticle:
1) Collector Settings
2) Collector Event Logs
3) Running Debug commands (simple commands which can help with basic troubleshooting)
4) Making changes on Collector Configuration
1)Collector Settings
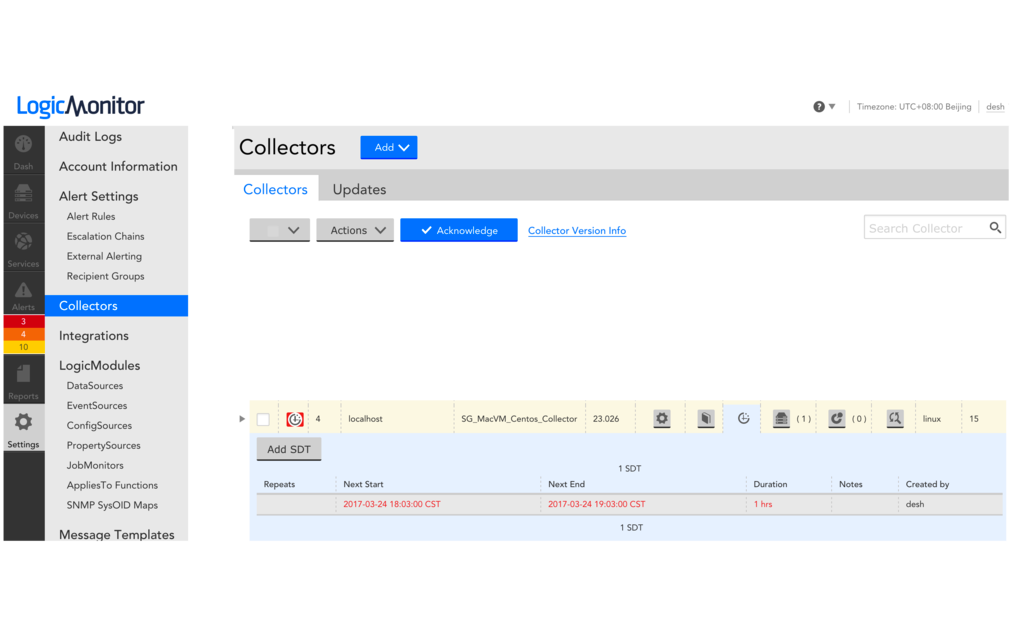
(a) How to check the Collector settings:
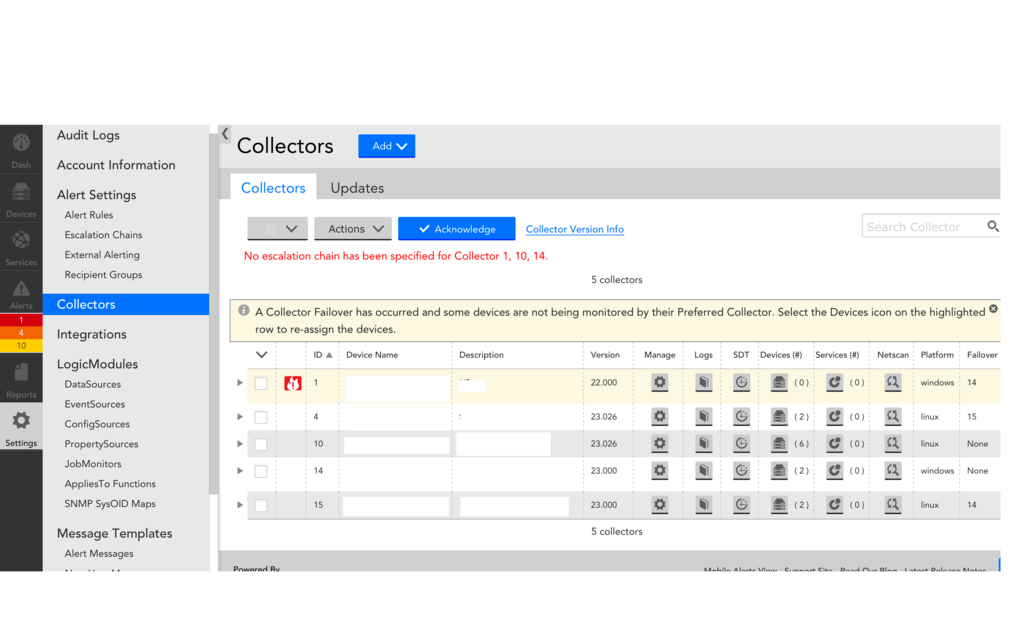
As shown in the above screenshot, the Settings - Collector: this is where you can gather all your collector information.
Key information provided here:
- Includes the Collector ID (this is an ID used to identify the collector on your portal).
- Device name and description of the Collector.
- Collector version that is being used.
- Managing the collector.
- Collector Logging.
- The Total number of devices and services managed by the collector and also the OS platform of the collector and if the collector is in Scheduled Downtime state or not.
- In addition, you will see the red symbol which indicates if a collector is down.
(b) Expand the collector to view further Collector Settings:
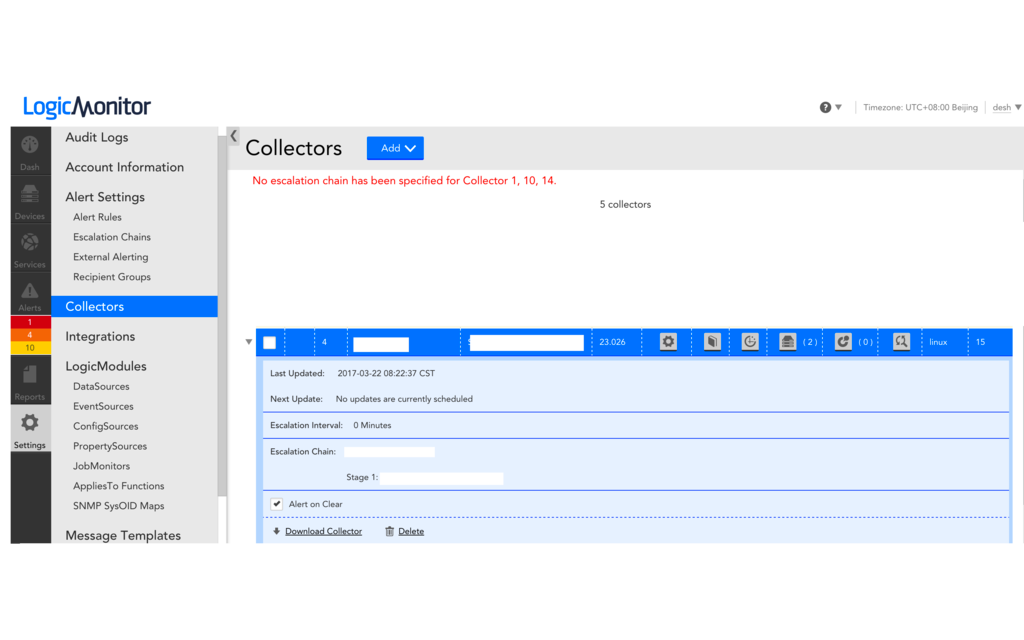
- This is where you can gather more information like Last updated and next updates for the collector, which is the escalation chain associated with the collector and which is the relevant Stage 1 recipients.
- In this option also you can download a collector or delete an existing collector (please do note when deleting a collector you have appropriately assigned the devices to other collectors before the deletion).
(c) Manage Collector
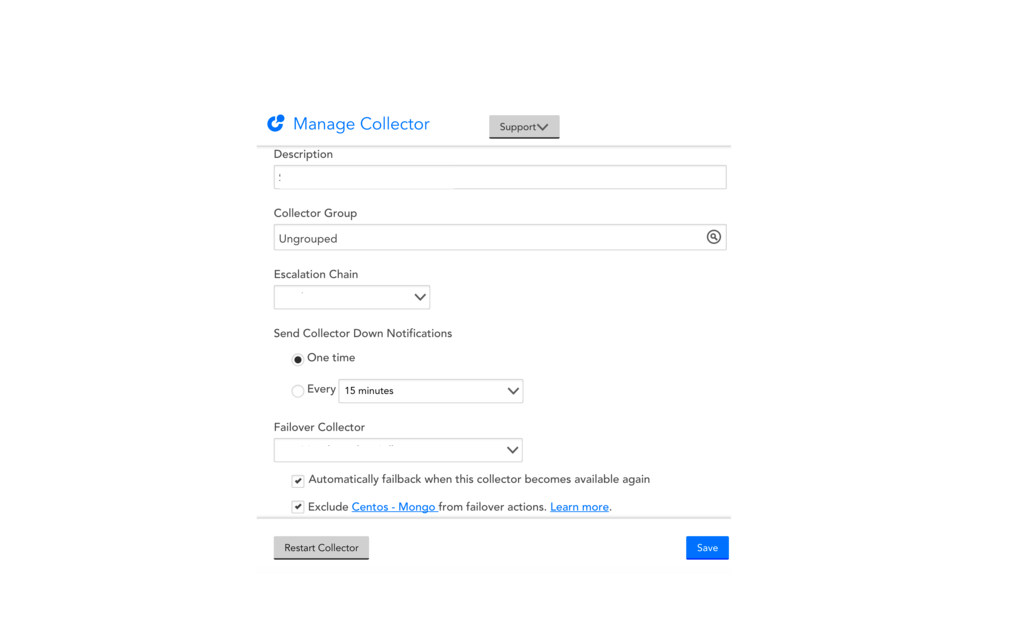
- In the Manage Collector option this is where you could configure the collector grouping , escalation chains and choose the appropriate failover collectors.
(d) Checking the Devices managed by the collector :
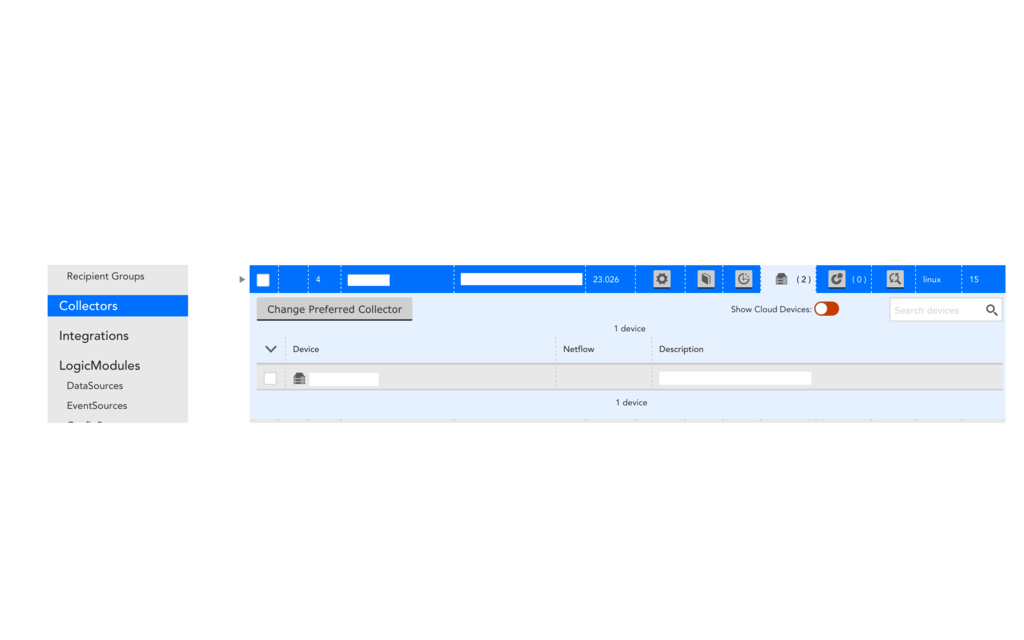
- On this option we can check which are the devices managed by the collector . Also we can change the preferred collector option on the device.
(e) Creating an SDT (scheduled downtime task) on the Collector.
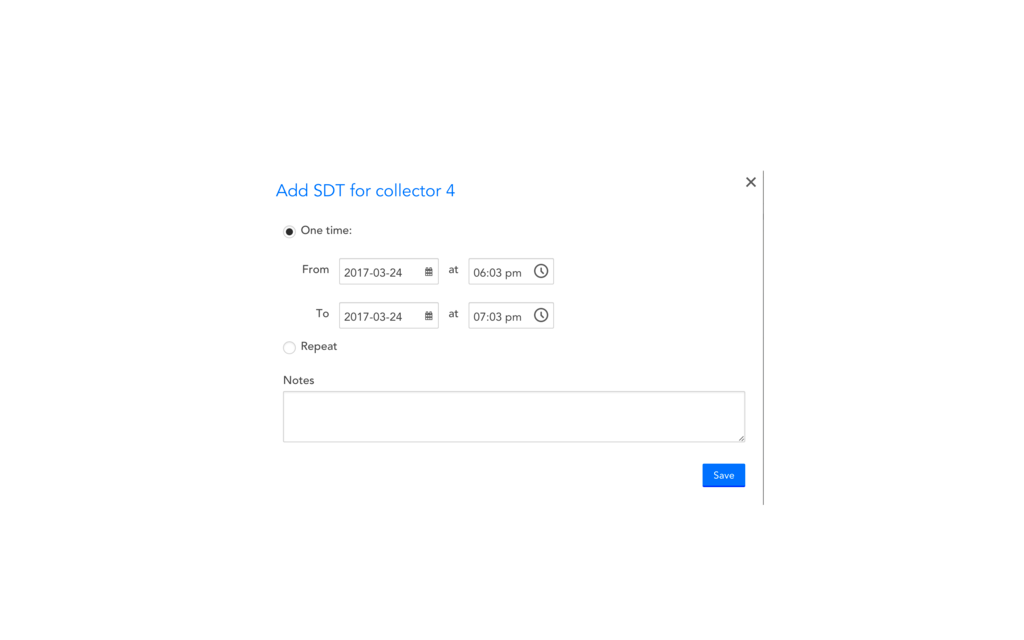
- You can go to the collector and Choose SDT and Add SDT and the first image shows you the timeframe you could configure and next image shows the status of your collector.
2) Collector Event Logs
(a) How to get to collector events
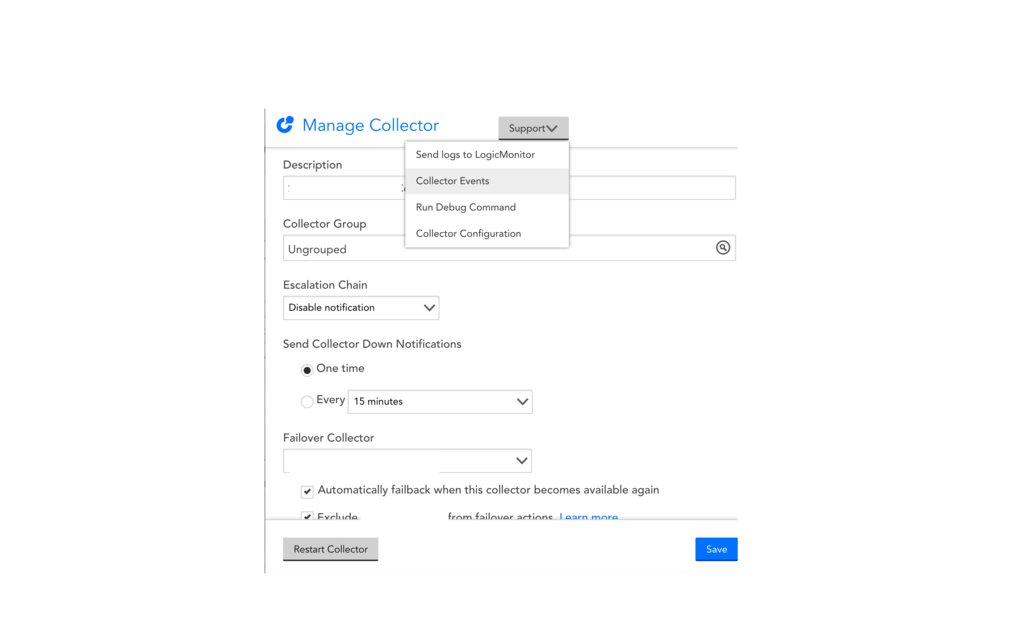
- Go to Manage collector as shown previous and click on the support tab and once this is done Choose Collector Events.
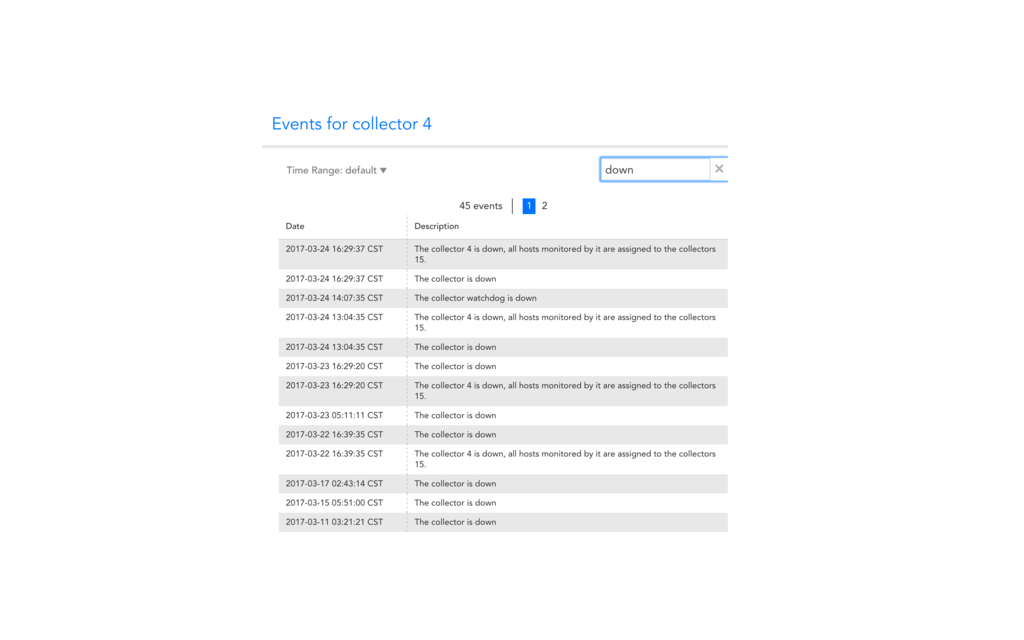
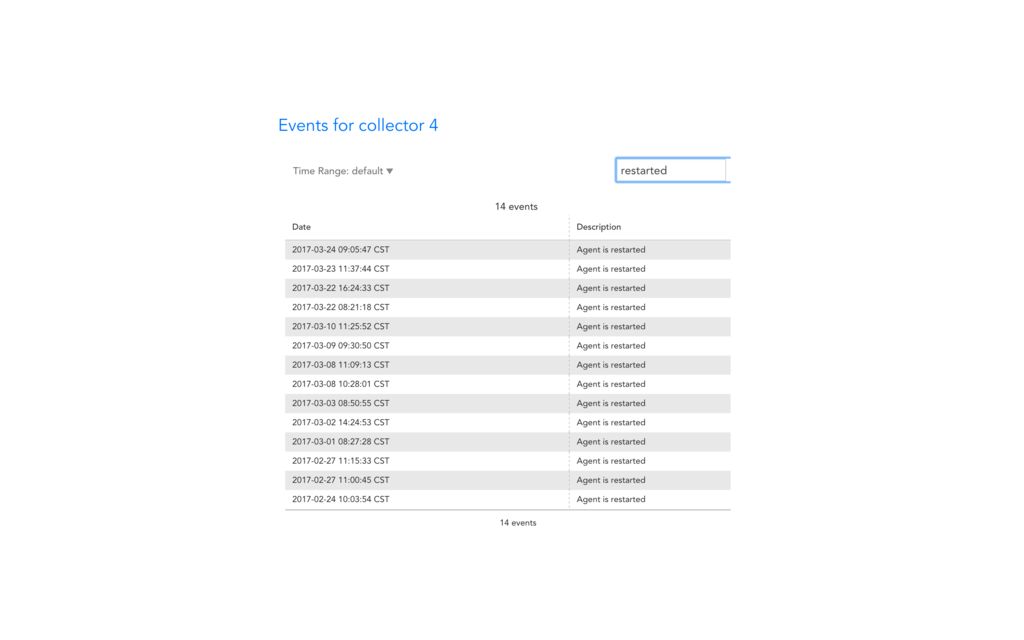
(b)Search on Collector Events
- On the collector events you will be able to see various information as shown below.
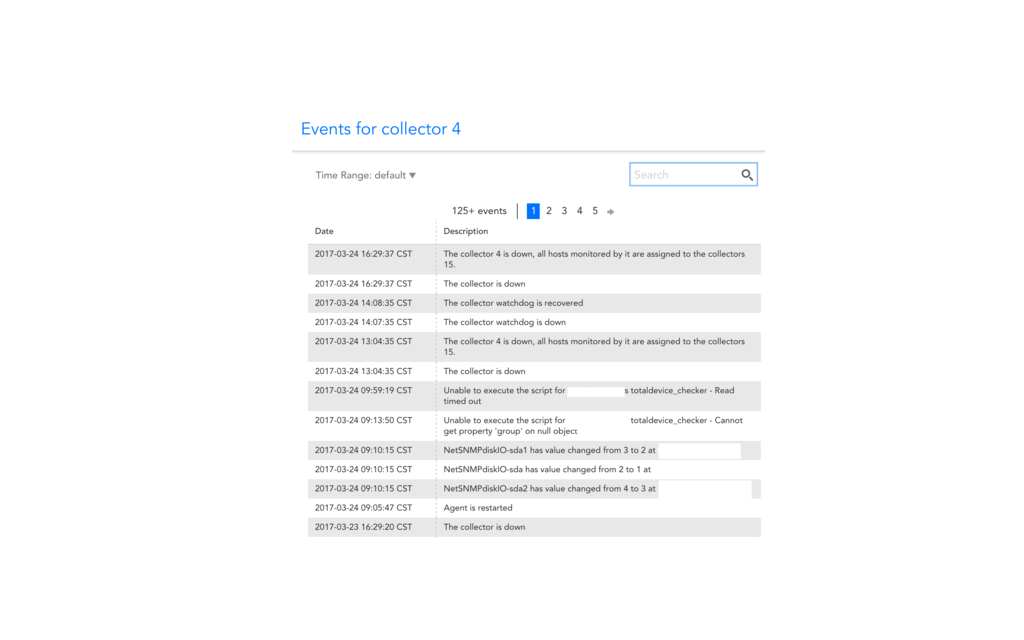
- By default the collector will restart every 8 hours and this will be written here (if there is a number of occurrence of collector restarting besides the 8 hour timeframe , you could come to tech support for further advise).
- Also if the collector constantly shows in a down state (we would advise you to contact technical support for further investigation).
- Keywords that you can search includes down ,restarted , timeout , unable to execute and also you could look for the hostname or IP address of your device to see whats the latest Collector event written for it.
(3) Running Debug commands (simple commands which can help with basic troubleshooting)
(a) How to access Debug command :
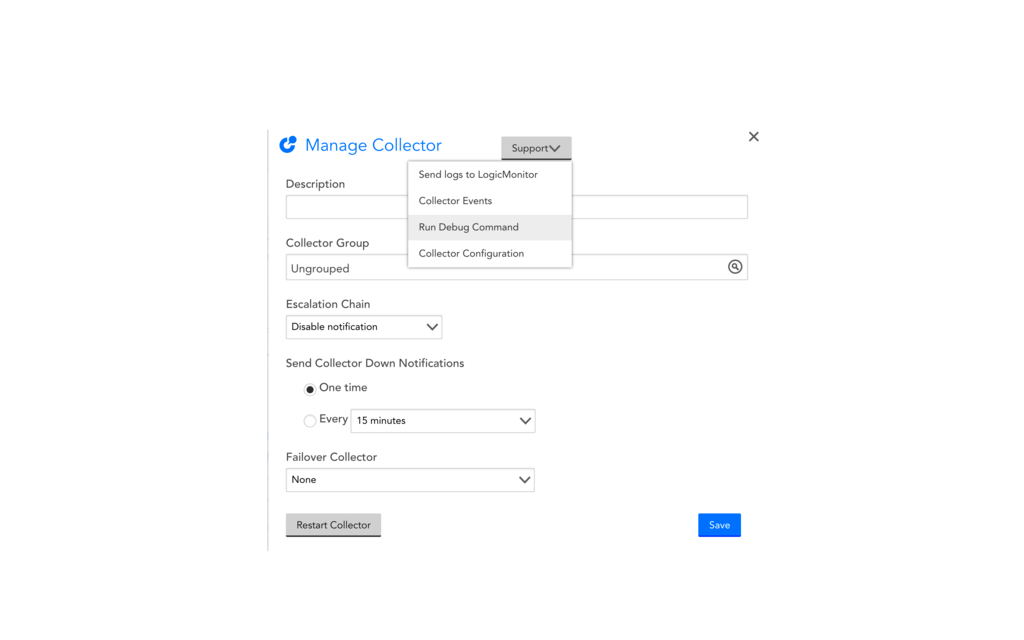
- Go to to Manage and Support - Select Run Debug Command.
(b) Debug Screen
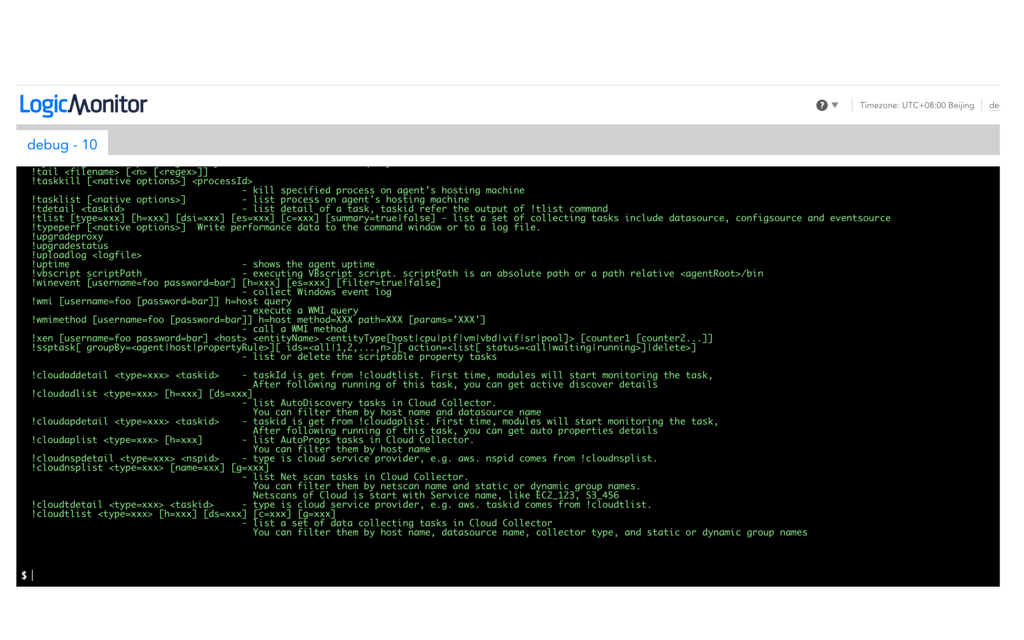
- When you access the debug screen it will show you all the lists of commands . All debug commands should be preceded with a '!'.
- In the list of built in commands, triangular brackets (i.e. < >) indicate a value that should be replaced and rectangular brackets (i.e. [ ]) indicate an optional argument that may be included.
- If you need an example of the syntax for a particular command, type 'help !command.
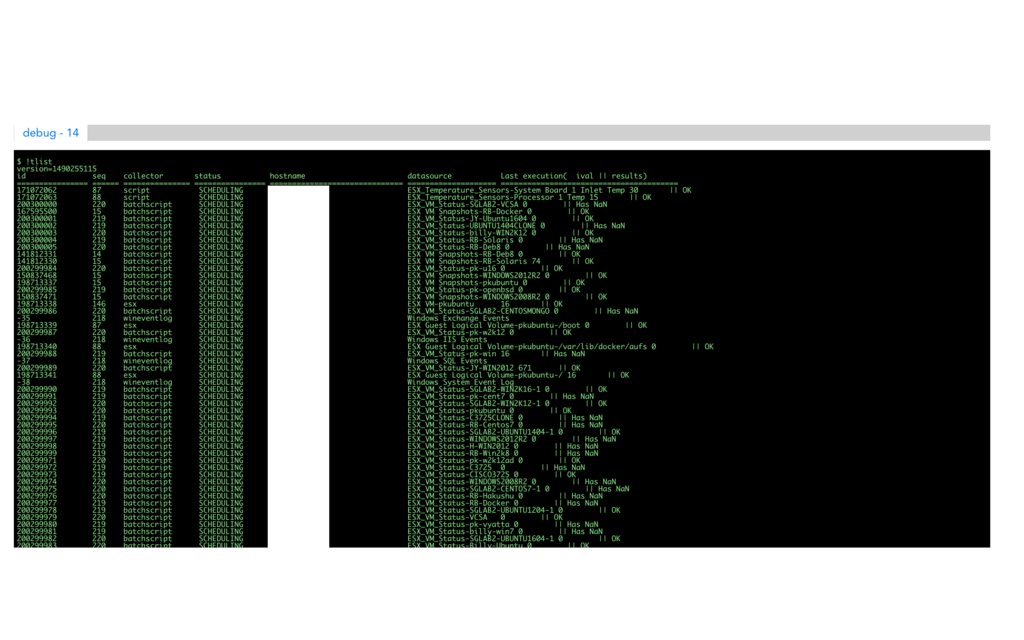
(c) !TLIST command
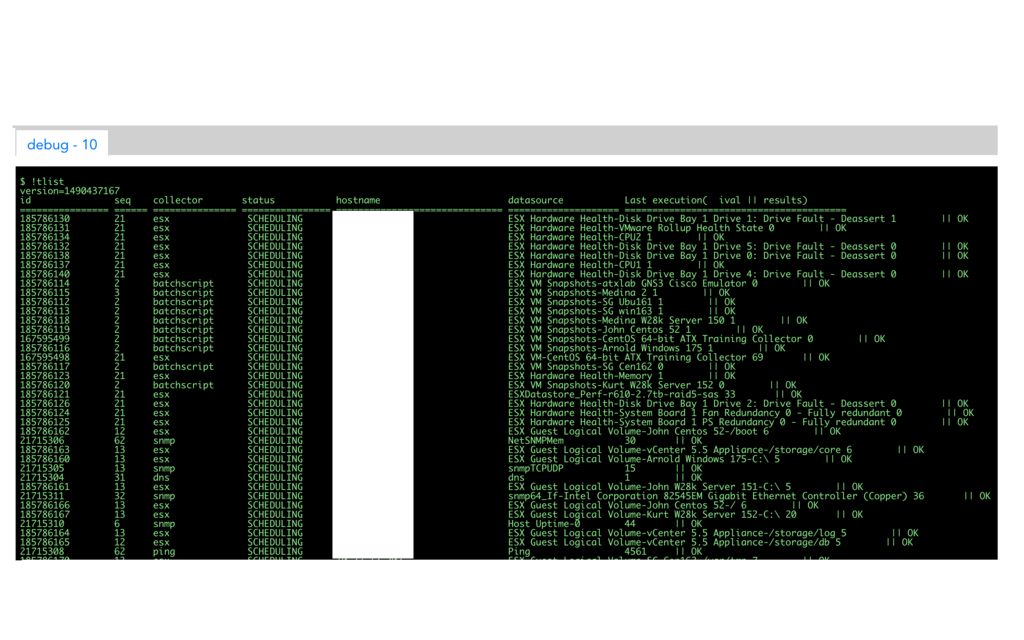
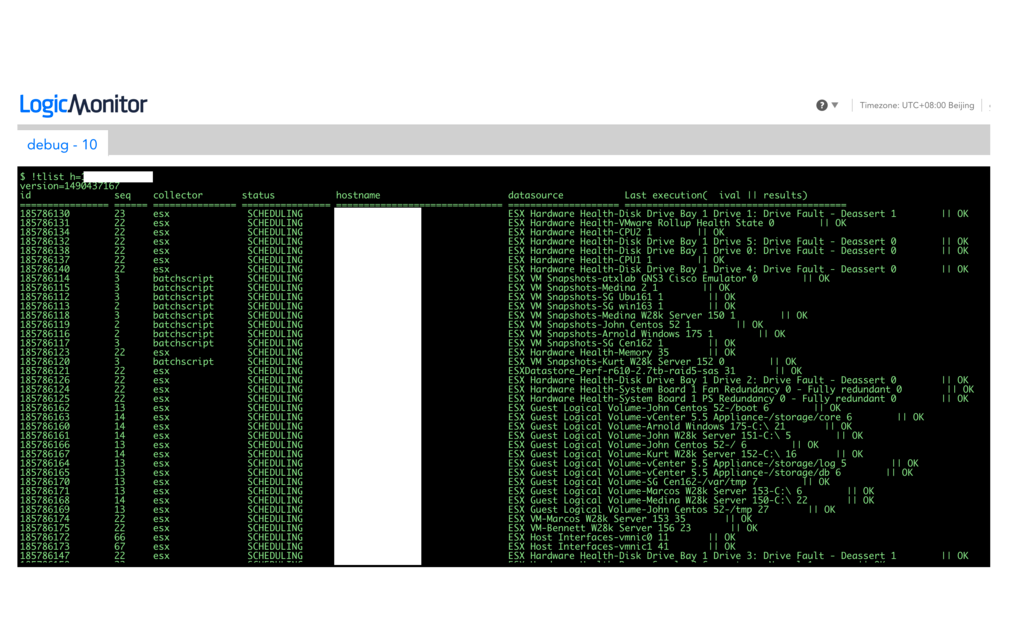
- Running !TLISTwould show all the tasks being processed by the collector on all devices.
- Running a !TLIST h=hostname will show the tasklist only for that particular device.
- As you can see here the !TLIST includes the task id , collection method , status which should as scheduling (if you see waiting this indicates the collector is taking a long time to execute any tasks or in a busy state) , hostname and also the datasource name and last execution this indicates the status of the collection , typically this should show as OK ,however if there no data collection you might see NaN or not executed yet or other errors.
(d) TDETAIL command :
- It will provide more detailed information on the tasks.
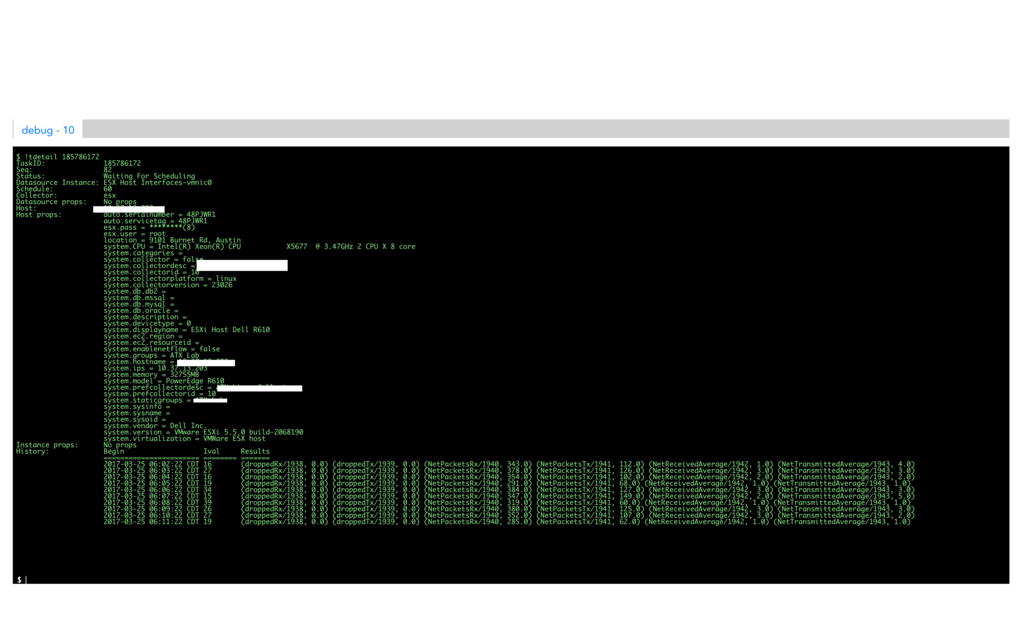
- A !TDETAIL command would require the task id also included.
- Example as shown i've how i've retrieved a task id from the previous !TLIST command used it for this !TDETAIL command.
(e) !ADLIST command
- This is useful to be used when you would like to check the status of active discovery on your collectors to see if the appropriate datasources are applying or not to your devices.
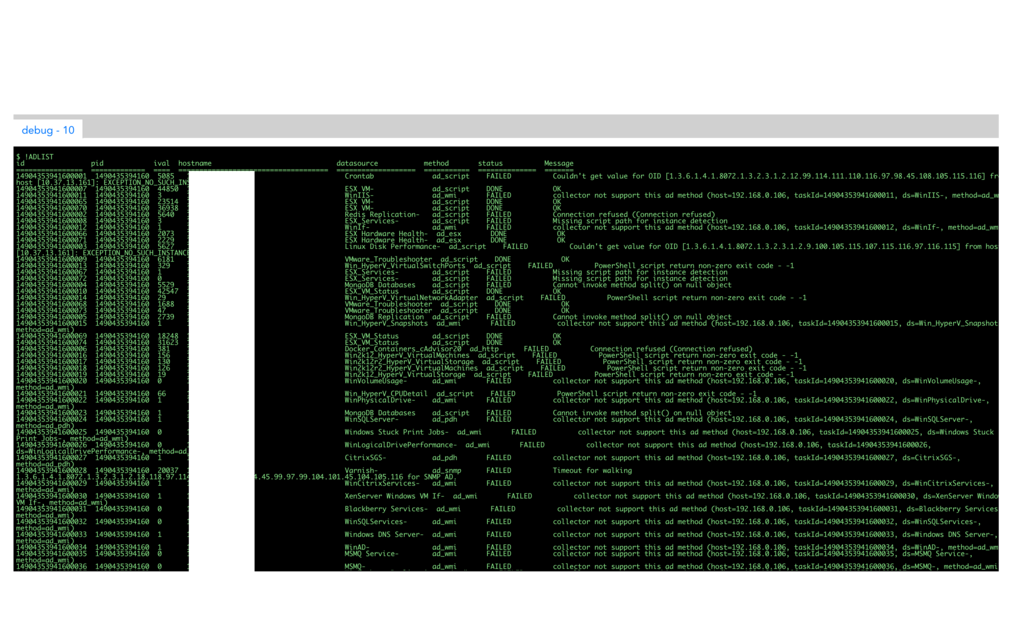
- You could also run an !ADLIST h=hostname to get information on individual devices.
- Key information you would need to check is the Status and Message shown and the !ADLIST id.
(f) !ADETAIL command
- The !ADETAIL command is used to get further information on a !ADLIST 14904353941600001(which is !ADLIST id) and check full details if a Datasource isn't applied.
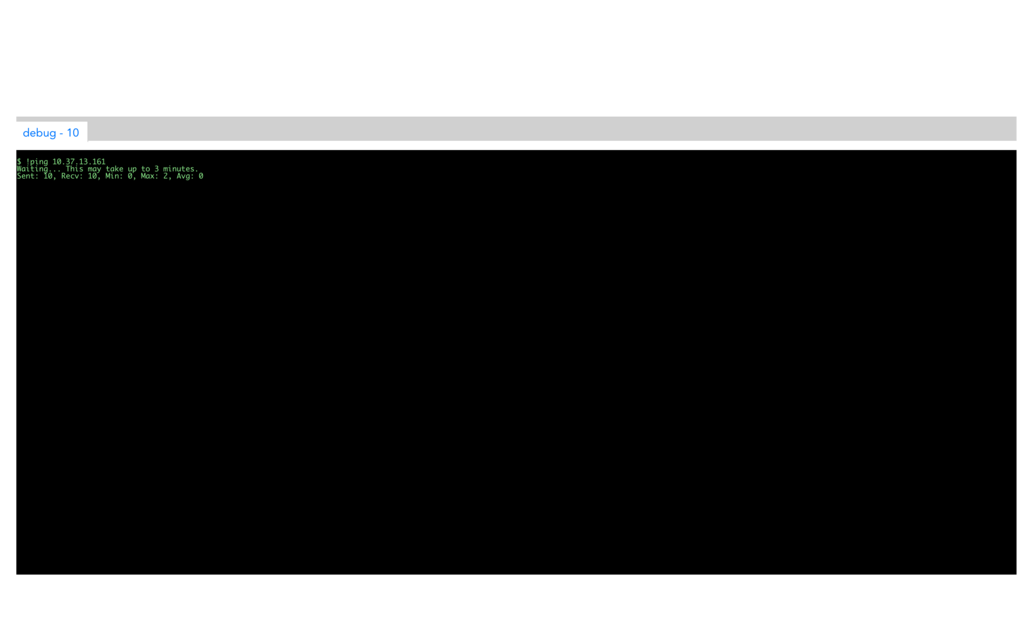
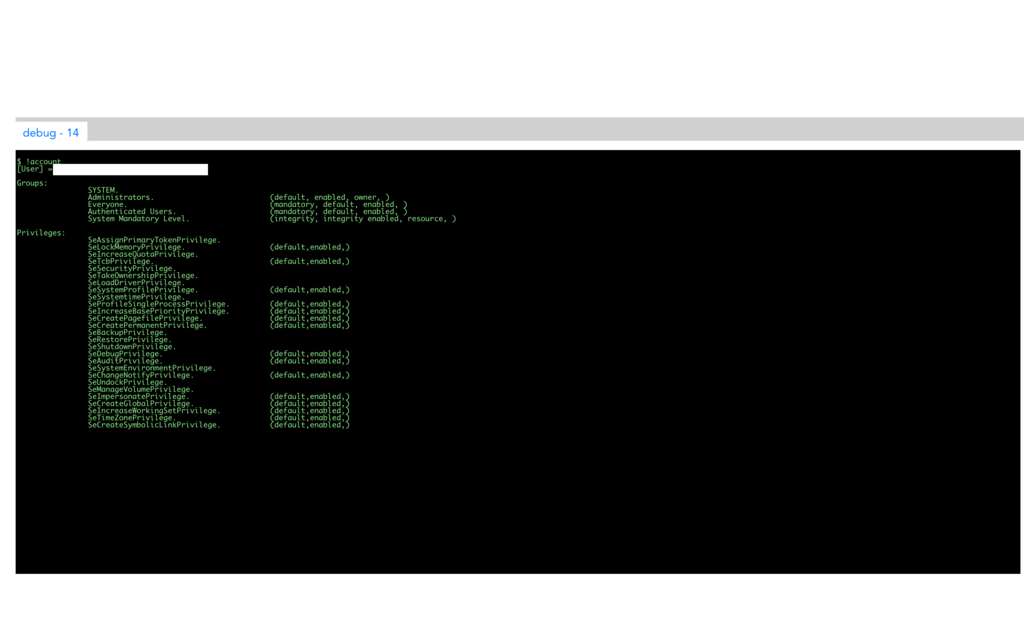
(g) !UPTIME and !PING and !ACCOUNT
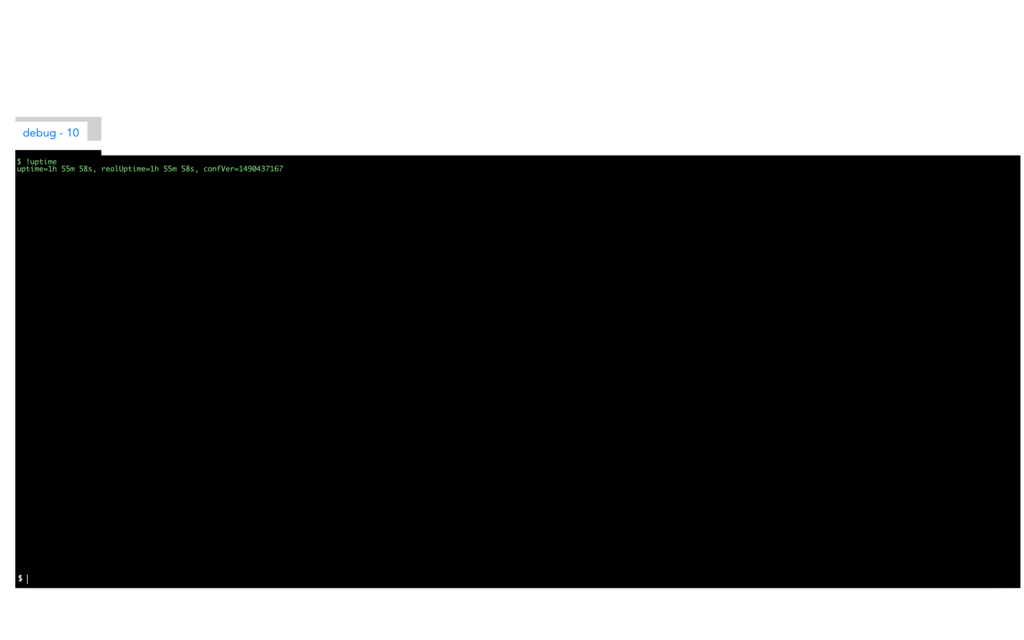
- !UPTIME is used to determine the collector uptime.
- !PING is used to ping a device to check if the device is available and responding.
- !ACCOUNT is used to determine which is account used to install and manage the collector (this is for Windows platform only).
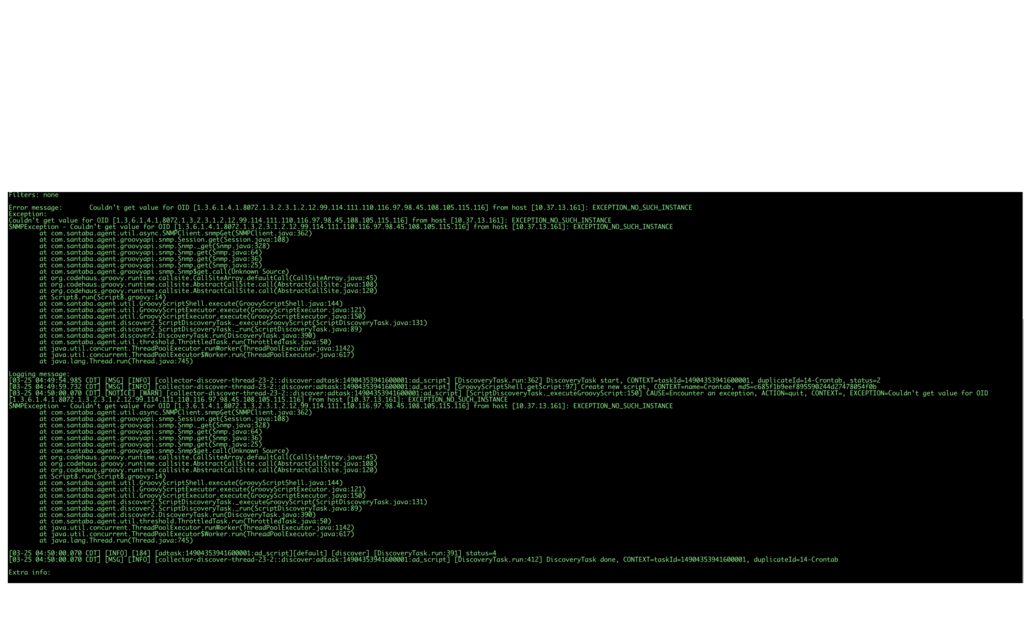
(h) !LOGSURF command
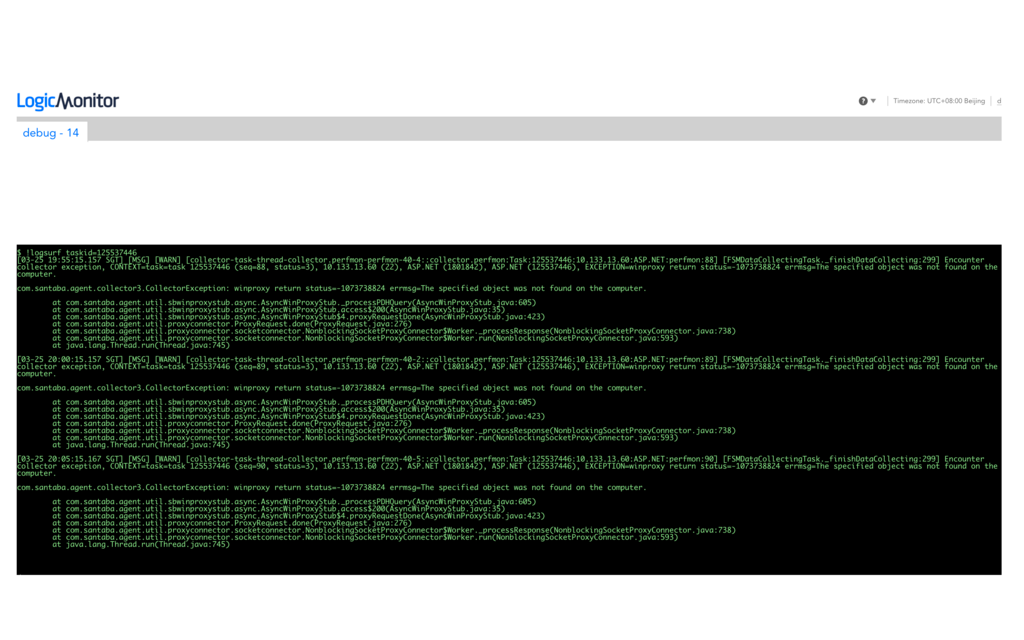
- !LOGSURF taskid= this is used to get further information from the logs on a status of a taskid (which can be retrieved from a !TLIST command).
- Sometimes when you run !LOGSURF taskid= it may not return any information , please try it a few times before it returns information.
(4) Making changes on Collector Configuration
- LogicMonitor Collectors have configuration files that can be used to control their behaviour. We can change this configuration files by going : Collectors | Manage | Support | Collector Configuration as shown below :
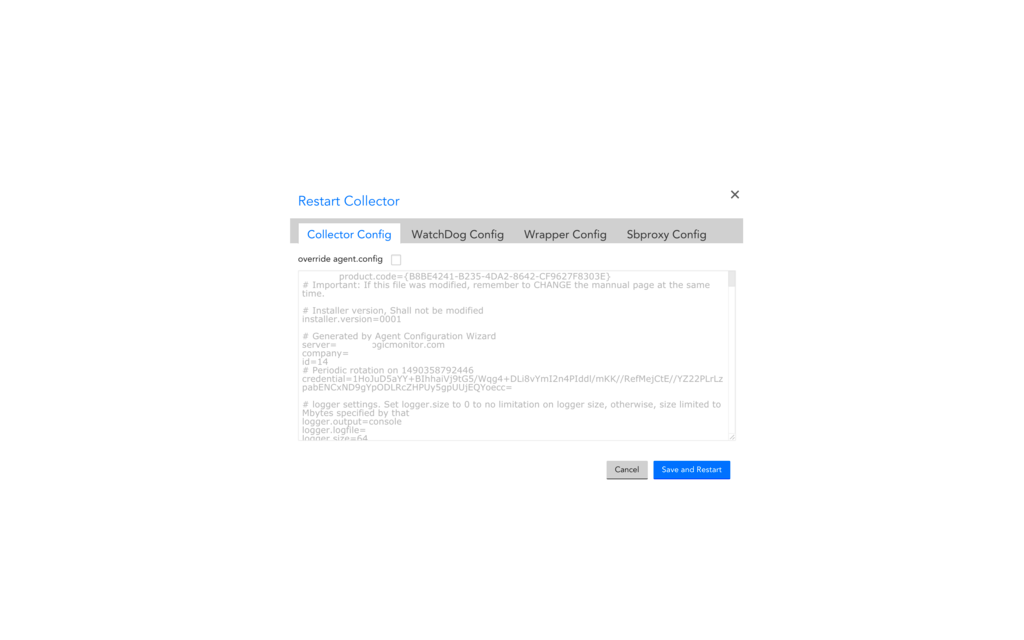
- We have four different tabs but i will cover the Collector Config and Wrapper config tab as this is commonly used.
(a) Making changes in Collector Config tab
- If you would like to make any changes in the Collector Configuration tab you would need to put a checkmark for override agent.config . Only then you can write information in the Collector configuration.
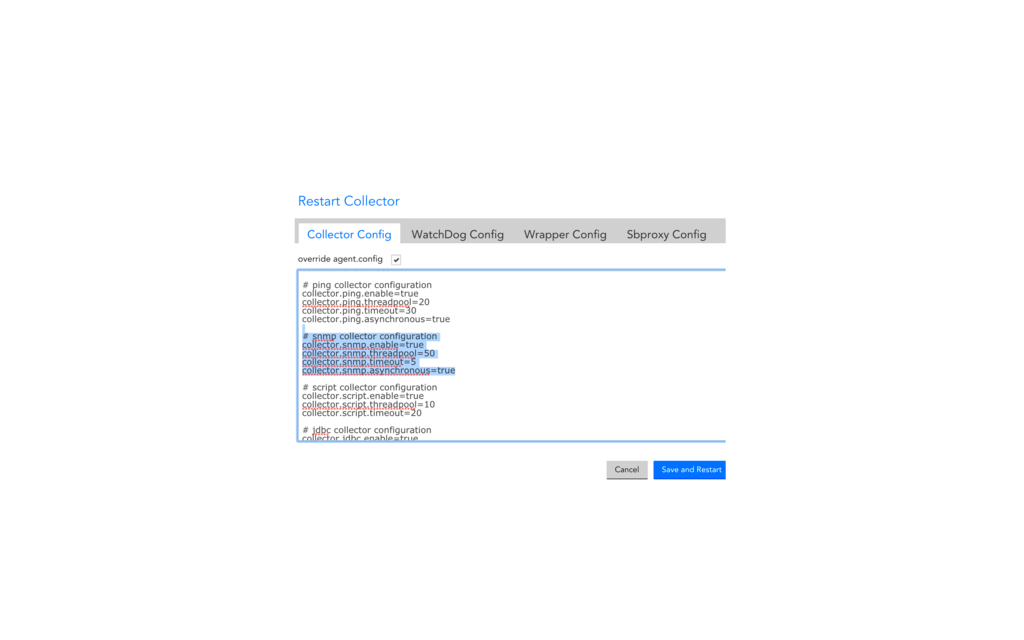
- Here as you can see we could could enable/disable snmp collector , increase/decrease the snmp timeout , increase or decrease the snmp threadpool and also change the snmp asynchronous status.
- This could be done for other data collection methods also.
- Please take note after you make changes you would need to restart the Collector from the LogicMonitor portal , you must click on the Option to Save and Restart to ensure the configuration is saved.
(b) Making changes in Wrapper Config tab
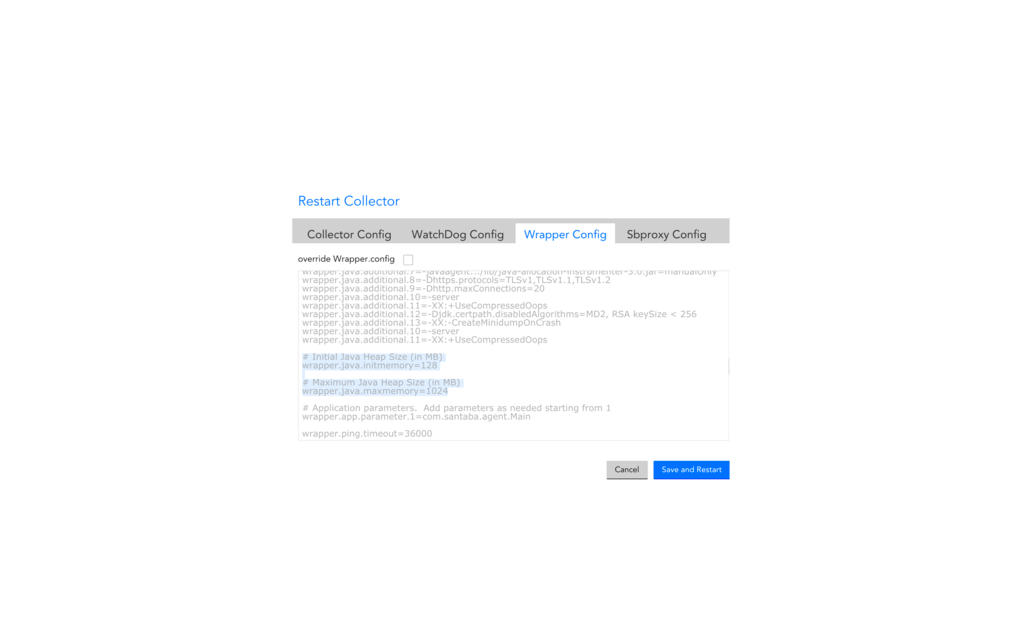
- On the wrapper configuration we could change the Initial Java Heap Size (in MB) and Maximum Java Heap Size (in MB).
- Please do consult the Technical Support team before making any changes in the Collector Configuration tabs or if uncertain on the impact of the changes you are making.