8 years ago
Changing the Time Range for Custom Graphs
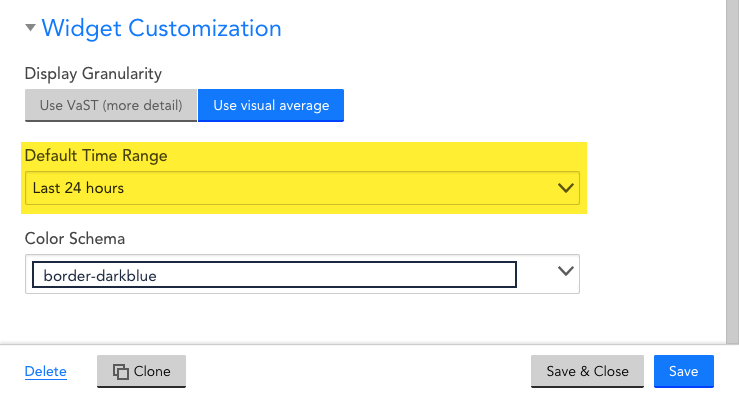
Is there a way to change the default time range when creating a custom graph? I'm trying to create graphs that collect hardware data points (CPU Utilization %, Mem Utilization %, etc.) and the collectors for the devices I'm monitoring were only recently installed but the time range is defaulting to several months ago making my graph unreadable (collection has only been occurring for a few days). Is there a way to shrink that time frame down or perhaps have the graph start closer to the collector installation date?