Forum Discussion
Antony_Hawkins Employee
9 years agoEmployeeHi Pandiyan,
You can create a dashboard custom graph widget and configure this to use Aggregate -> Sum (rather than e.g. top 5, top 10, top 25).
You can do this for e.g. all interfaces on a single device, or across multiple devices, as necessary, by manipulating the group, device, and instance selection fields within the widget configuration.
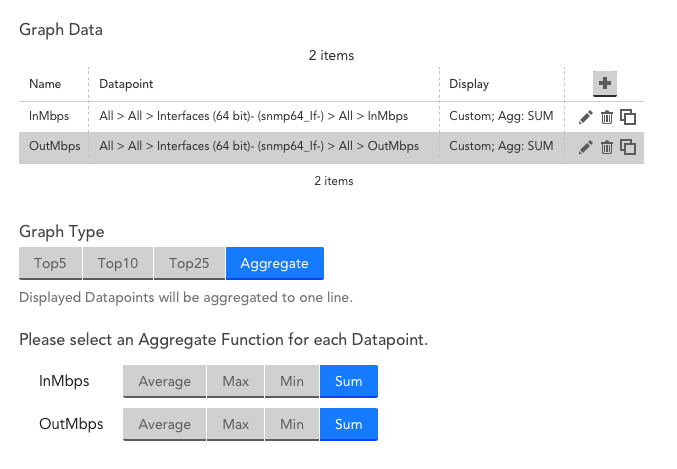
Once you have defined the datapoints (by group(s), device(s) and instance(s) required) you can select the 'Aggregate' option in the graph configuration and 'Sum' as the aggregation method:
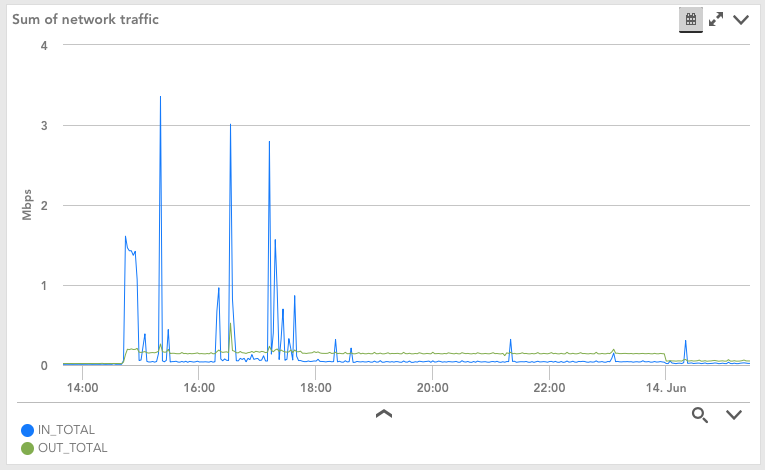
This will produce one line on the graph, per datapoint:
You can also add virtual datapoints in to custom graph widgets, which would let you add the in and out totals together to provide a single, combined, line, if desired.
Additionally, you can create a new overview graph to show an aggregation (sum|min|max|average) across all instances on a single device in the DataSource definition, such that the totals could be seen in the device view without creating a dashboard and custom graph widget. Please contact support for assistance with this, and see this documentation page for more details:
I hope this helps.