A Closer Look At How SLA Is Calculated In Reports
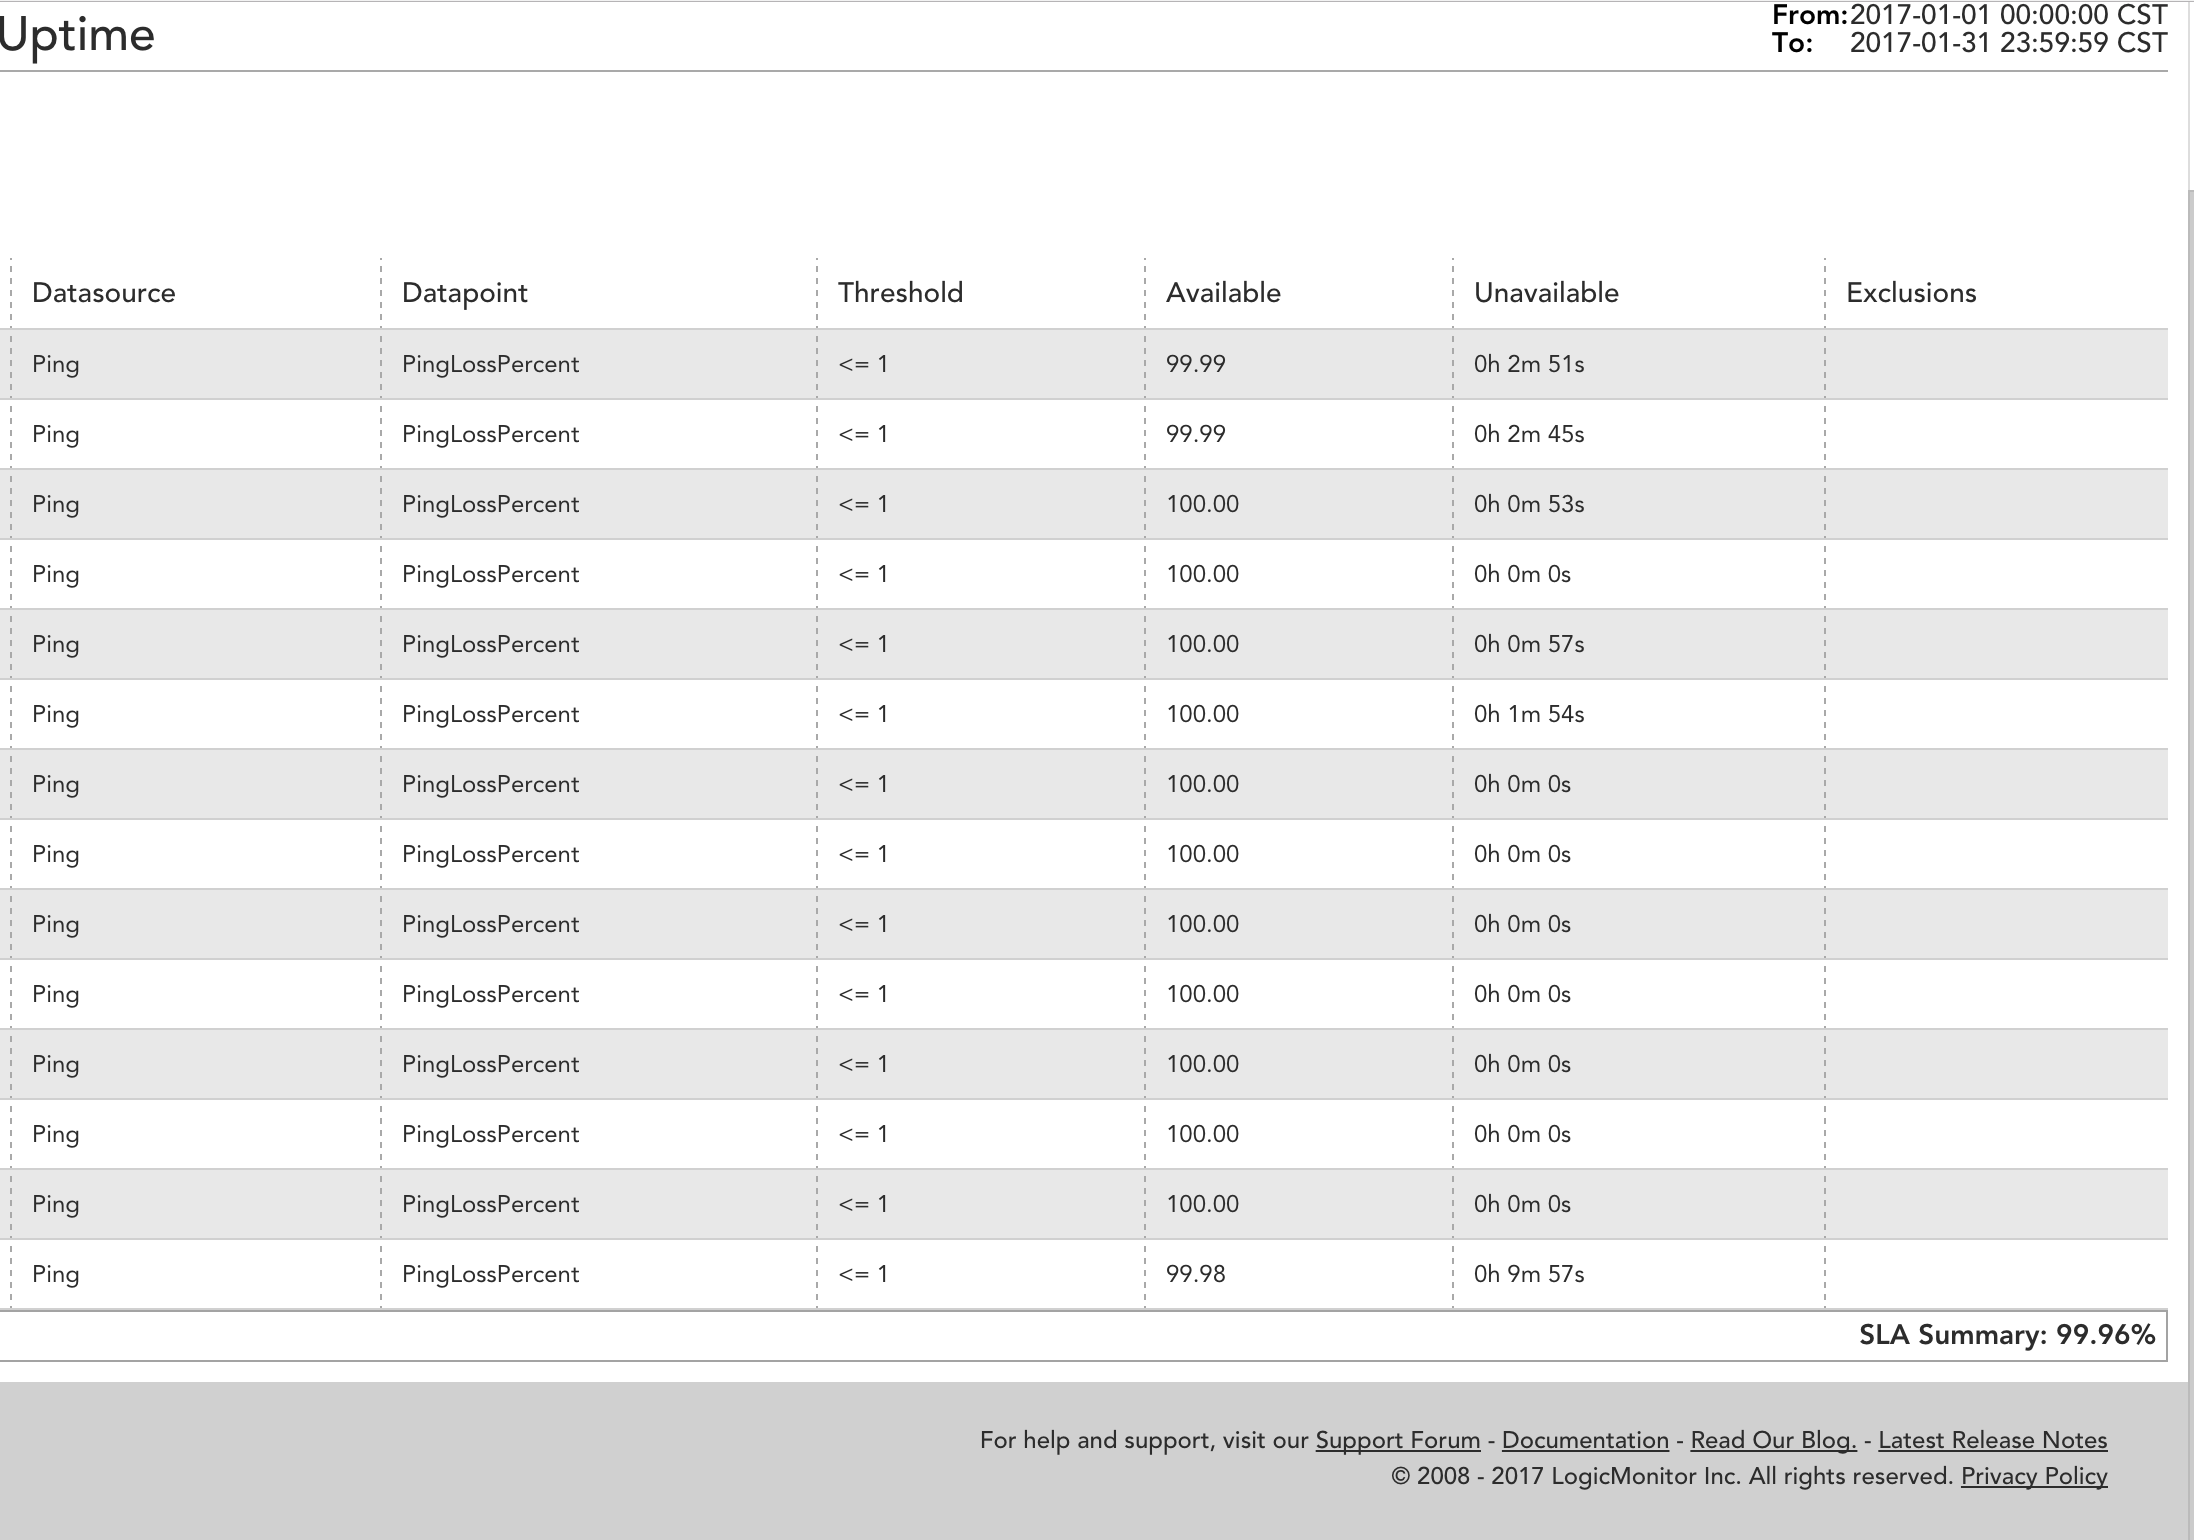
Upon first looking at this report, we think “this can’t be right”.
Quote

How do you end up with an SLA summary of 99.96% when our available times under 100% are 99.99%, 99.99%, and 99.98% respectively?
Well, I had a suspicion that this SLA Summary was not calculated using the “available” percentage figures, but in fact was using each and every second of unavailable time in the “unavailability” column, including the time that was too infinitesimal to be factored in as a violation against the “100%” values.
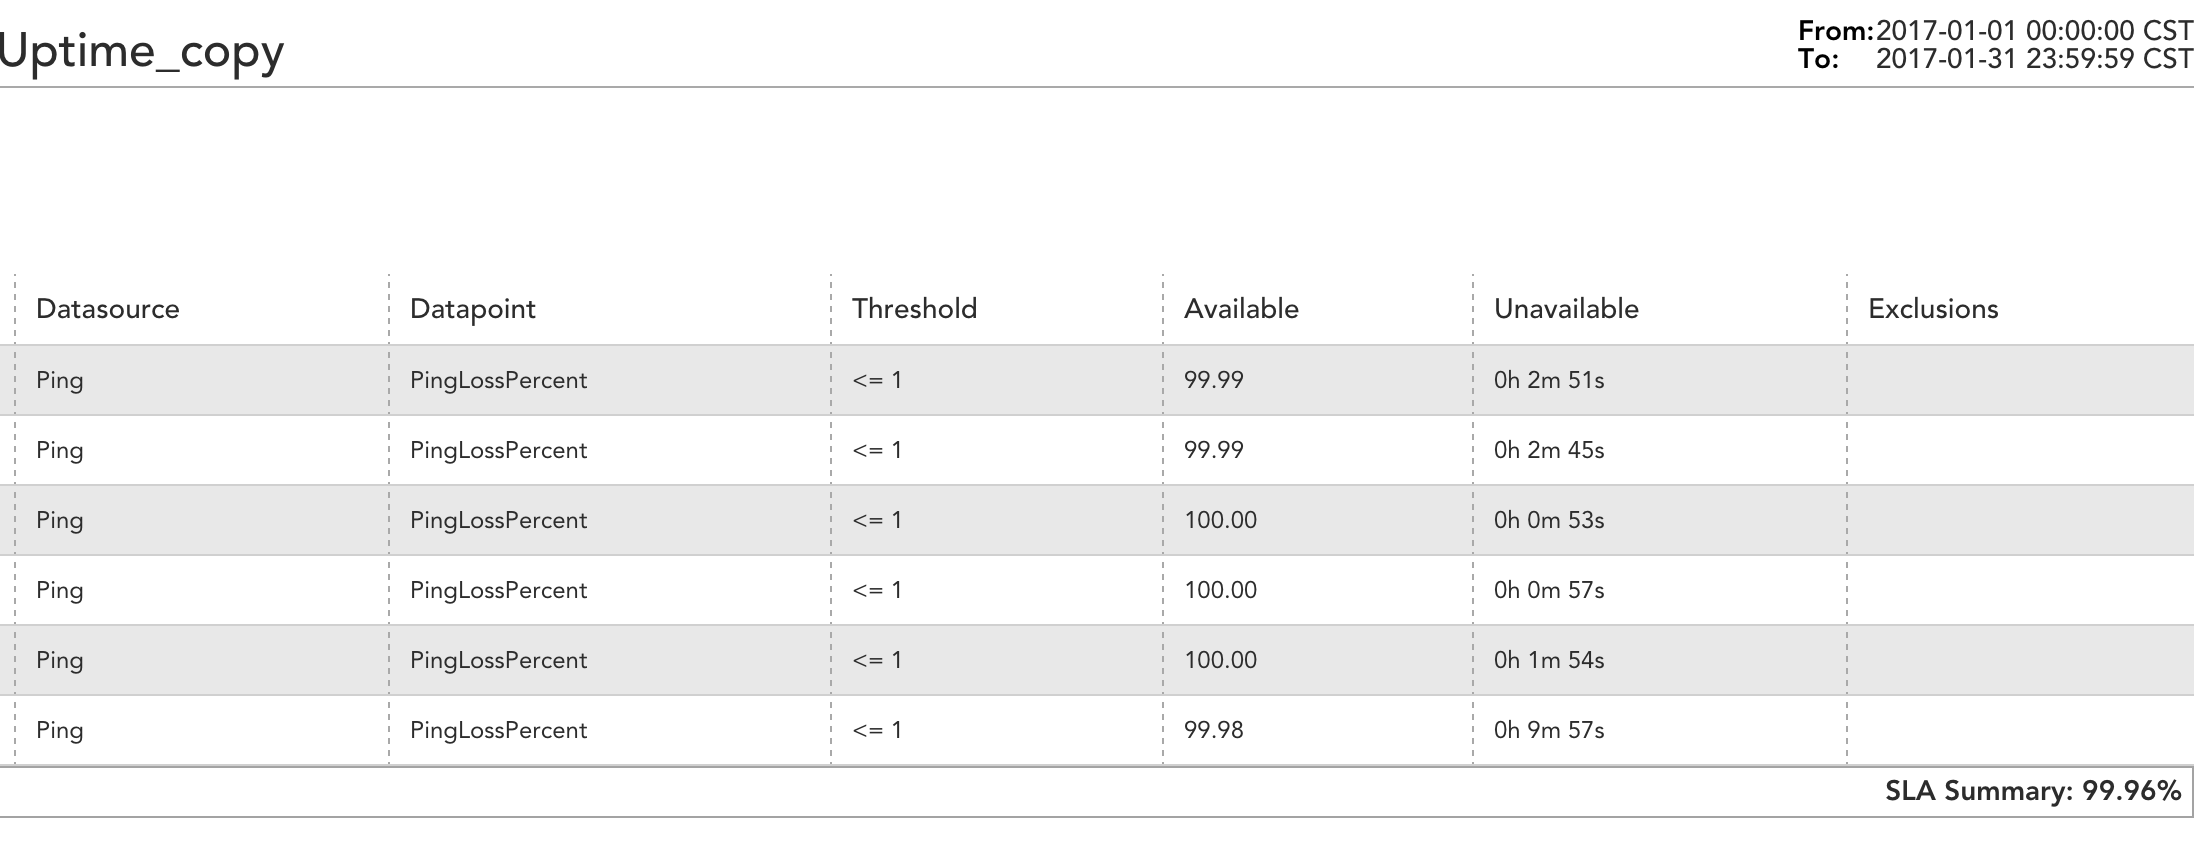
So, I created a copy of the report, this time checking the “Only display Devices with less than 100% availability.” option.

So, I get this back. a-ha! so, the “100%” figures are still there provided they had ANY unavailable time. The report is in fact factoring in every second of unavailability time.

There are 2,678,400 seconds in a 31 day month.
The total amount of seconds in the “unavailable” column tally up to 1,156
1156 is 0.043160095579450414 % of 2,678,400
100- 0.043160095579450414= 99.9568399044%
.........or 99.96% when rounded up to the nearest hundredths.