Product Manager
New Settings Beta!
Welcome to the new Settings Beta! The new Settings page offers the same great functionality in the legacy UI with some new items that unlock powerful capabilities such as HTTP OAuth 2.0, Event Driven Ansible, and improved navigation. Your feedback is extremely valuable to us so please feel to chime in.
What’s changed in Settings v4?
Improved Navigation
The first thing you might notice after enabling the settings preview is that it has a familiar structure in the left-hand navigation with an updated feel. The improved settings navigation comes with functionality to: collapse/expand core features in the navigation list along with filtering and sorting across the different settings areas.
Audit Logs
A couple of noteworthy mentions in Audit Logs is a more readable table structure with an easier to use Filter. You’ll notice that you can see much more information in the description with an arrow to expand more details at the end of the description.
Account Information
Account Information has three main paths: Portal Information, Portal Settings, and Financial. You’ll notice when you want to edit information that the controls will look different such as a pencil and when adding contacts information you don’t need to save each row.
- Contacts (previous UI) was renamed to Portal Information which more accurately describes its content.
- Portal Settings now contains contact information
- Financial has the same billing and payment information as before but with an easier to read structure with the familiar edit controls.
Usage (Beta)
This is an exciting new capability that lets you visualize LM license usage. Right now LM Logs and APM Metrics are supported if you’re using those products today.
- LM Logs - you’ll notice a “Products” dropdown that lets you select the product you want to view data for. At a glance, you’ll see month-to-date usage, can select some top usage analysis queries, and view cumulative usage. All of this data is filtered by the month and has control. One cool thing about the cumulative usage graph is that it has some forecasting ability which can be helpful for spotting potential overages.
- APM Metrics contains a combined view along with APM Push Metrics and APM OpenMetics. All views have the same visuals, controls, and functionality as the LM Logs product
- More products coming to Usage in future releases!
Alert Settings
Alert Settings should feel very consistent with improved readability. You’ll notice filtering capability added to Root Cause Analysis and External Alerting.
Collectors
Collectors page has a familiar table layout and controls to other pages in Setting creating a theme of consistency. Under the collector tab you have a new ability to filter by all collectors or collector groups.
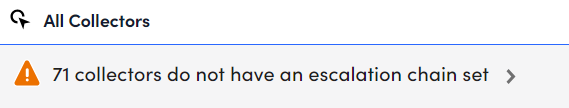
- Within the table you have the ability to view if an escalation chain is configured in the table. If an escalation chain is found it will send the name.
- The collector actions for each collector are now in the a new bottom panel, with the info, resources, SDT and websites tabs
- The collector bulk actions can be performed now by selecting collectors (checking the boxes) and applying the bulk action from the menu when it shows up. (In UIV3, there was a button called actions present all the time)
- In the legacy UI, manage flows were hidden under the support button in the manage form, now these are accessible from the collectors main page bottom panel.
- The previous add flow had at least four modals, we have now reduced it to single modal for confirmation on save.
- The collector status screen was a blob of data on a single page earlier, now this information has been organized into a table that can be filtered and in a more readable format.
- The collector updates tab now shows a table with an update type column that helps users see what status the updates are in, (very similar to the SDT tab in alerts), showing the active/ scheduled NetScans.
OpenTelemetry Collectors
OpenTelemtry was introduced in the legacy Settings page allowing you to consume your application traces.
Integrations
We’re very excited to announce Event Driven Ansible and OAuth2.0 for Custom HTTP in the new Settings. Event Driven Ansible allows you to unlock the power of alerts and take remediation actions based on an alert. You’ll notice that the Integrations page has a familiar structure to the legacy UI with filters and tabs. All the controls for the table were moved to the left side column called “Actions”
OpsNotes
OpsNotes carries over the same structure from the legacy UI with updated filtering controls to help you find what you’re looking for with ease.
LogicModules
Updates to the LogicModules settings coming in a future release.
Message Templates
Message Templates introduces a new left hand navigation that allows you to filter by alert type. When an Alert Type is selected you’re able to define the alert and clear message with fewer clicks through the gear icon.
NetScans
NetScans page has a familiar table layout and controls to other pages in Settings, creating a theme of consistency. Under the collector tab you have a new ability to filter by all collectors or collector groups. NetScans no longer opens up with a blank right panel, it shows all the NetScans so the user has the option to view information by clicking the manage icon.
User Access
User Access has a new left hand navigation that contains some filtering options to help you find what you’re looking for. You can filter by groups and by users with the updated UI controls.