Forum Discussion

silvanbucheli's avatar
7 months ago

New "Logs Tab" on each Device

Hello all,

In the new UI I found the tag "Logs" for each monitored device. But there is nothing visible in this log.

What is being logged here?

It would be very interesting to see all actions on this device (enable/disable data points, edit thresholds, etc).


Thanks in advance for a short feedback.

7 Replies

  • It would be very interesting to see all actions on this device (enable/disable data points, edit thresholds, etc).

    This is something that I would find Really useful actually! anything from the audit log about the resource/instance I’m already looking at in Resources in a tab would help keep my train of thought going and help reduce distractions that may come up by seeing other things on my way to the audit log.
     

  • I do have LM Logs enabled and logs available, but i still show nothing. Reaching out to support now.

  • That, yes.

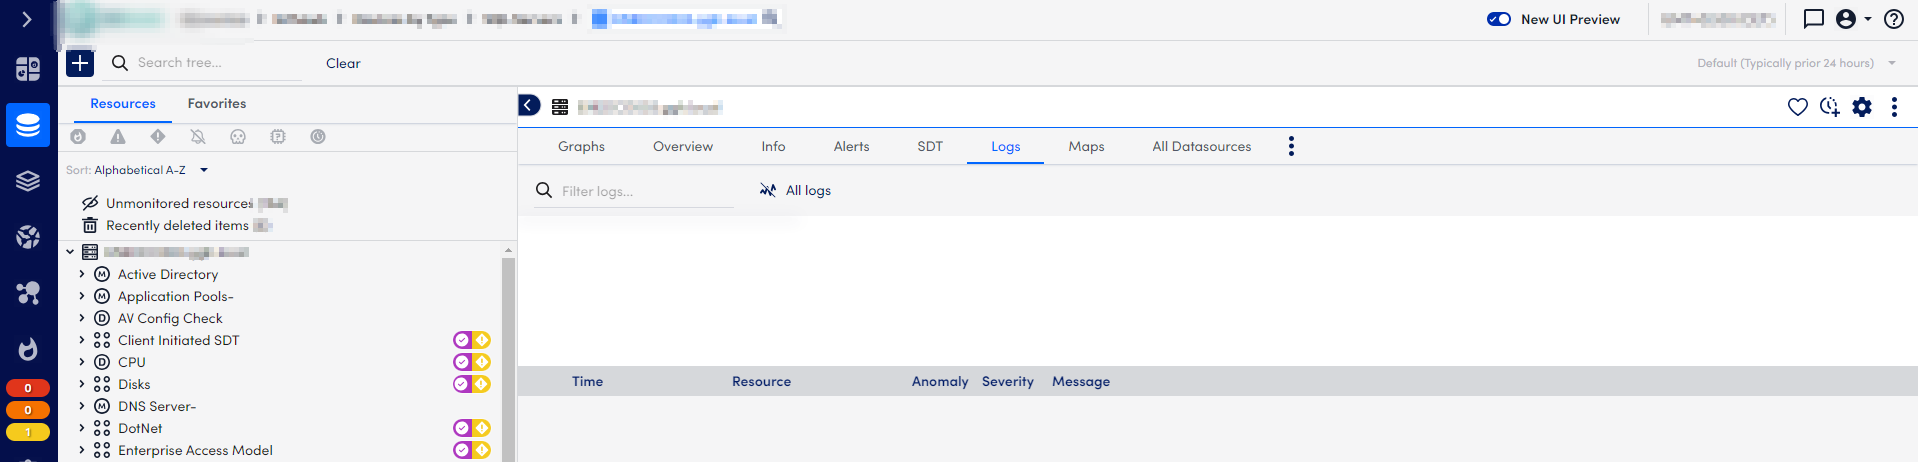
    Also, no matter what adjustment i make, i cannot see any logs. All i get is “no data” and an empty header graph as shown in the screenshot above. This happens on groups and on devices. Just spoke with support and oddly he was able to get the logs to show up. We got together over zoom and he could not get mine to show the logs.

    In UIv3, it works fine because it navigates to the logs page itself with the filter pre-populated.

    On that point: I was really excited when the webinar earlier this week referenced loading the logs right in the logs tab on the resources page. It’s a really cool idea and will help streamline troubleshooting. However, the logs functionality on the logs tab is unnecessarily neutered. The timeframe is grayed out. I can’t use the query language to search through the logs, there’s only the clear text search, and...

    The “all logs” vs. “anomalies only” is unclear in what it does. The affordance and signifier are there, but the mapping is unclear. When it says “all logs” does that mean that all logs are being shown or if i click the button all logs will be shown (meaning not all logs are being shown right now)? When it says “anomalies only” does that mean that only anomalies are being shown or if i click the button it will then only show anomalies?

    “The presentation has to match how people view the goal they are trying to achieve and their expectations.” -Don Norman (The Design of Everyday Things, page 72, Chapter 2: The Psychology of Everyday Actions)

    This is not happening, so I don’t know which state to have this button in.

  • This is part of the LM Logs Module. It is an addon to the portal. Personally, I don’t believe it should be showed if you do not have the module enabled.

  • Sarah_Luna's avatar
    Sarah_Luna
    Icon for Product Manager rankProduct Manager

    Joe is right - you’ll see this populated if you have LM Logs. I’ll take a note that we should hide this tab if it’s not applicable to avoid confusion. 

  • Before you ask, yes, i still show nothing even after I disable the default filter that only shows anomalies.

    That default filter is bad. It should default to showing all logs, or give me a user preference that i can save.

  • Sarah_Luna's avatar
    Sarah_Luna
    Icon for Product Manager rankProduct Manager

    Before you ask, yes, i still show nothing even after I disable the default filter that only shows anomalies.

    That default filter is bad. It should default to showing all logs, or give me a user preference that i can save.

    okay I think I misunderstood.  The problem here is that you see the tab, you just don’t see any information when you first navigate to the tab and there’s really no indicator on whether you have to adjust the filters or if there truly are no logs for this device (?)