To monitor website access via Zscaler using LogicMonitor, you can set up web checks to verify if the websites are accessible and responsive. LogicMonitor's web checks allow you to periodically test the availability and performance of websites from different geographic locations. Here's how you can set up monitoring for website access via Zscaler:
Pre-requisite
- You will need to have introduced the Zscaler client to the LM Collector Server placed in the network environment where Zscaler is used for communication to access the Internet via websites. Zscaler reference doc for more information :
- Our Collectors gather information from your infrastructure, encrypt it, and deliver it to the LogicMonitor Service through an outbound TLS-encrypted connection, where it is stored, processed and presented back to users through a web interface.
- Every LogicMonitor customer has a DNS record of [customername].logicmonitor.com. This record resolves to two or more public IP addresses at any given time. Because these IP addresses can and do change over time, it’s imperative that your network’s firewall(s) permit access to all of our public IP addresses
For more information about these IP addresses you may refer to the following article - - We recommend whitelisting *.logicmonitor.com for your network. In addition, you will need outbound TCP port 443 and port 80 access. Port 80 is only used if one attempts to access LogicMonitor via a non-secure http address. This will initially reach port 80 and then be redirected to port 443 for encryption. In order to use our Remote Session functionality, you will also need RDP or SSH on port 443.
-
Create Web-Checks in LogicMonitor:
- Log in to your LogicMonitor account.
- Navigate to Settings > Alerts > Web Checks.
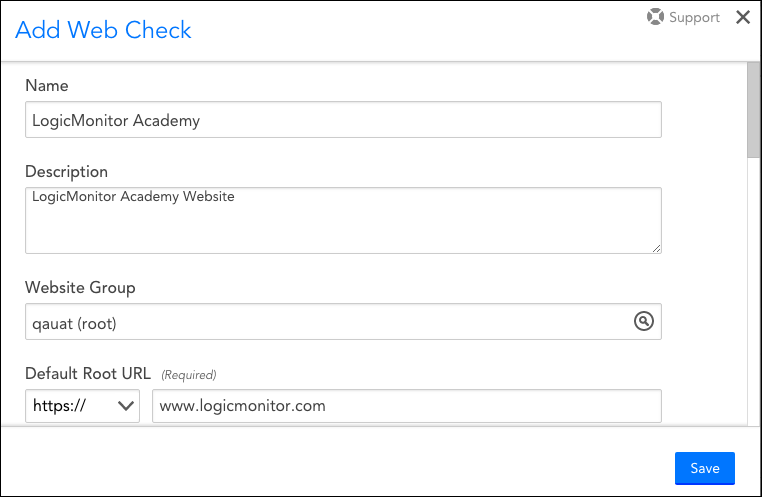
- Click on Add Web Check to create a new web check: https://www.logicmonitor.com/support/services/adding-managing-services/adding-a-web-service
-
Configure LM Web-Check Parameters:
- Enter the URL of the website you want to monitor.
- Choose the check frequency (how often the website is checked).
- Select the geographic locations from which the checks will be performed. You can choose locations that are relevant to your customer's usage of Zscaler.
- Set up alert thresholds for response time, HTTP status codes, or other relevant metrics: https://www.logicmonitor.com/support/services/adding-managing-services/adding-a-web-service#:~:text=will%20be%20sent.-,Configuring%20URL%20Request%20and%20Response%20Settings,-For%20every%20Web
-
Test to perform on Zscaler client environment:
- To simulate website access through Zscaler, you might need to set up LogicMonitor to perform web checks from the customer's network. This could involve configuring LogicMonitor collectors within the customer's network environment.
-
Response Time and Status Code Monitoring:
- Monitor the response time and HTTP status codes returned by the website. This helps you identify slow or unavailable websites.
-
Alerting and Notifications:
- Set up alert thresholds based on your customer's requirements. For example, you can configure LogicMonitor to trigger alerts if the response time exceeds a certain threshold or if specific HTTP status codes are returned : https://www.logicmonitor.com/support/services/about-services/services-alerts
-
Custom Scripting (Optional):
- If Zscaler adds specific headers or modifies responses, you might need to customize your web checks accordingly. LogicMonitor supports custom scripting for advanced monitoring scenarios.
Remember that setting up web checks from within your customer's network environment might require coordination with their IT team, as well as consideration of security and compliance policies. Additionally, LogicMonitor's capabilities might evolve over time, so refer to their documentation or support resources for the most up-to-date guidance on web checks and monitoring configurations.
 LM Champion