Universal 'No Data' monitoring
Problem: How do you know how many collection tasks are failing to return data on any given device?
You could set "no data" alerting, but that's fraught with issues. An SNMP community can give access to some parts of the OID tree and not others, so unless you set "no data" alerts on every SNMP metric or DataSource (DO NOT DO THIS!!) you might not see an issue. If you do do this, be prepared for thousands of alerts when SNMP fails on one switch stack...
Here are a suite of three LogicModules that cause the collector to run a '!tlist' (task list) debug command per monitored resource, which produces a summary output of task types being attempted on the resource, counts of those task types, and counts of how many have some or all metrics returning 'NaN' (no data).
As the collector is running the scripts, no credentials are needed.
Unusually, I've used a PropertySource to do the work of Active Discovery, because right now the Groovy import used isn't available in AD scripts and an API call (and therefore credentials) would have been necessary. Additionally, creating a property for instances gives further abilities to the DataSources in terms of comparing what the collection scripts find vs what they were expecting to find, meaning they can "fill in the blanks" and identify a need to re-run Active Discovery.
There are then two DataSources, one returning counts and NaN counts per task type, and the other returning total counts and NaN counts, plus counts of task types not yet discovered by the PropertySource (i.e., Active Discovery is needed - don't worry, that'll sort itself out with the daily Auto Properties run).
There are no alert thresholds set as presented here, and the reasons are various. Firstly there's no differentiation between tasks that have *some* NaN values and tasks with *all* NaN values. That would demand massively more (unfeasibly more) scripting. Therefore it's a bit fuzzier than just being able to say "Zero is fine, anything else is bad". Secondly, some DataSources sometimes have some NaN values without this indicating any sort of failure. Every environment is different so what we're looking for here is patterns, trends, step changes, that sort of thing - these metrics would be ideal presented in top-N graphs in a dashboard, at least until you get a feel for what's "normal" in your environment. This will help guide you to resources with high percentages of tasks returning no data without generating alert noise.
Enjoy...
UPDATE 2022-08-09 - scroll down for updated, improved, re-written "v2" modules that provide more data.
PropertySource:
"NoData_Tasks_Discovery": v1.3: NPEMD9
DataSources:
"NoData_Tasks_By_Type": v1.3: N6PXZP
"NoData_Tasks_Overall": v1.3: 3A4LAJ
Substantial kudos goes to @Jake Cohen for enlightening me to the fact that the TlistTask import existed and these were therefore possible. Standing on the shoulders of giants, and all that.
NB. Immediately after a collector restart, the NoData counts and percentages will likely drop to zero, because while the collector will know the tasks it's going to run, none of them have failed since the restart because they haven't been attempted yet. Therefore, don't set delta alerts.
It might look a bit like this in a dashboard for total tasks per resource:
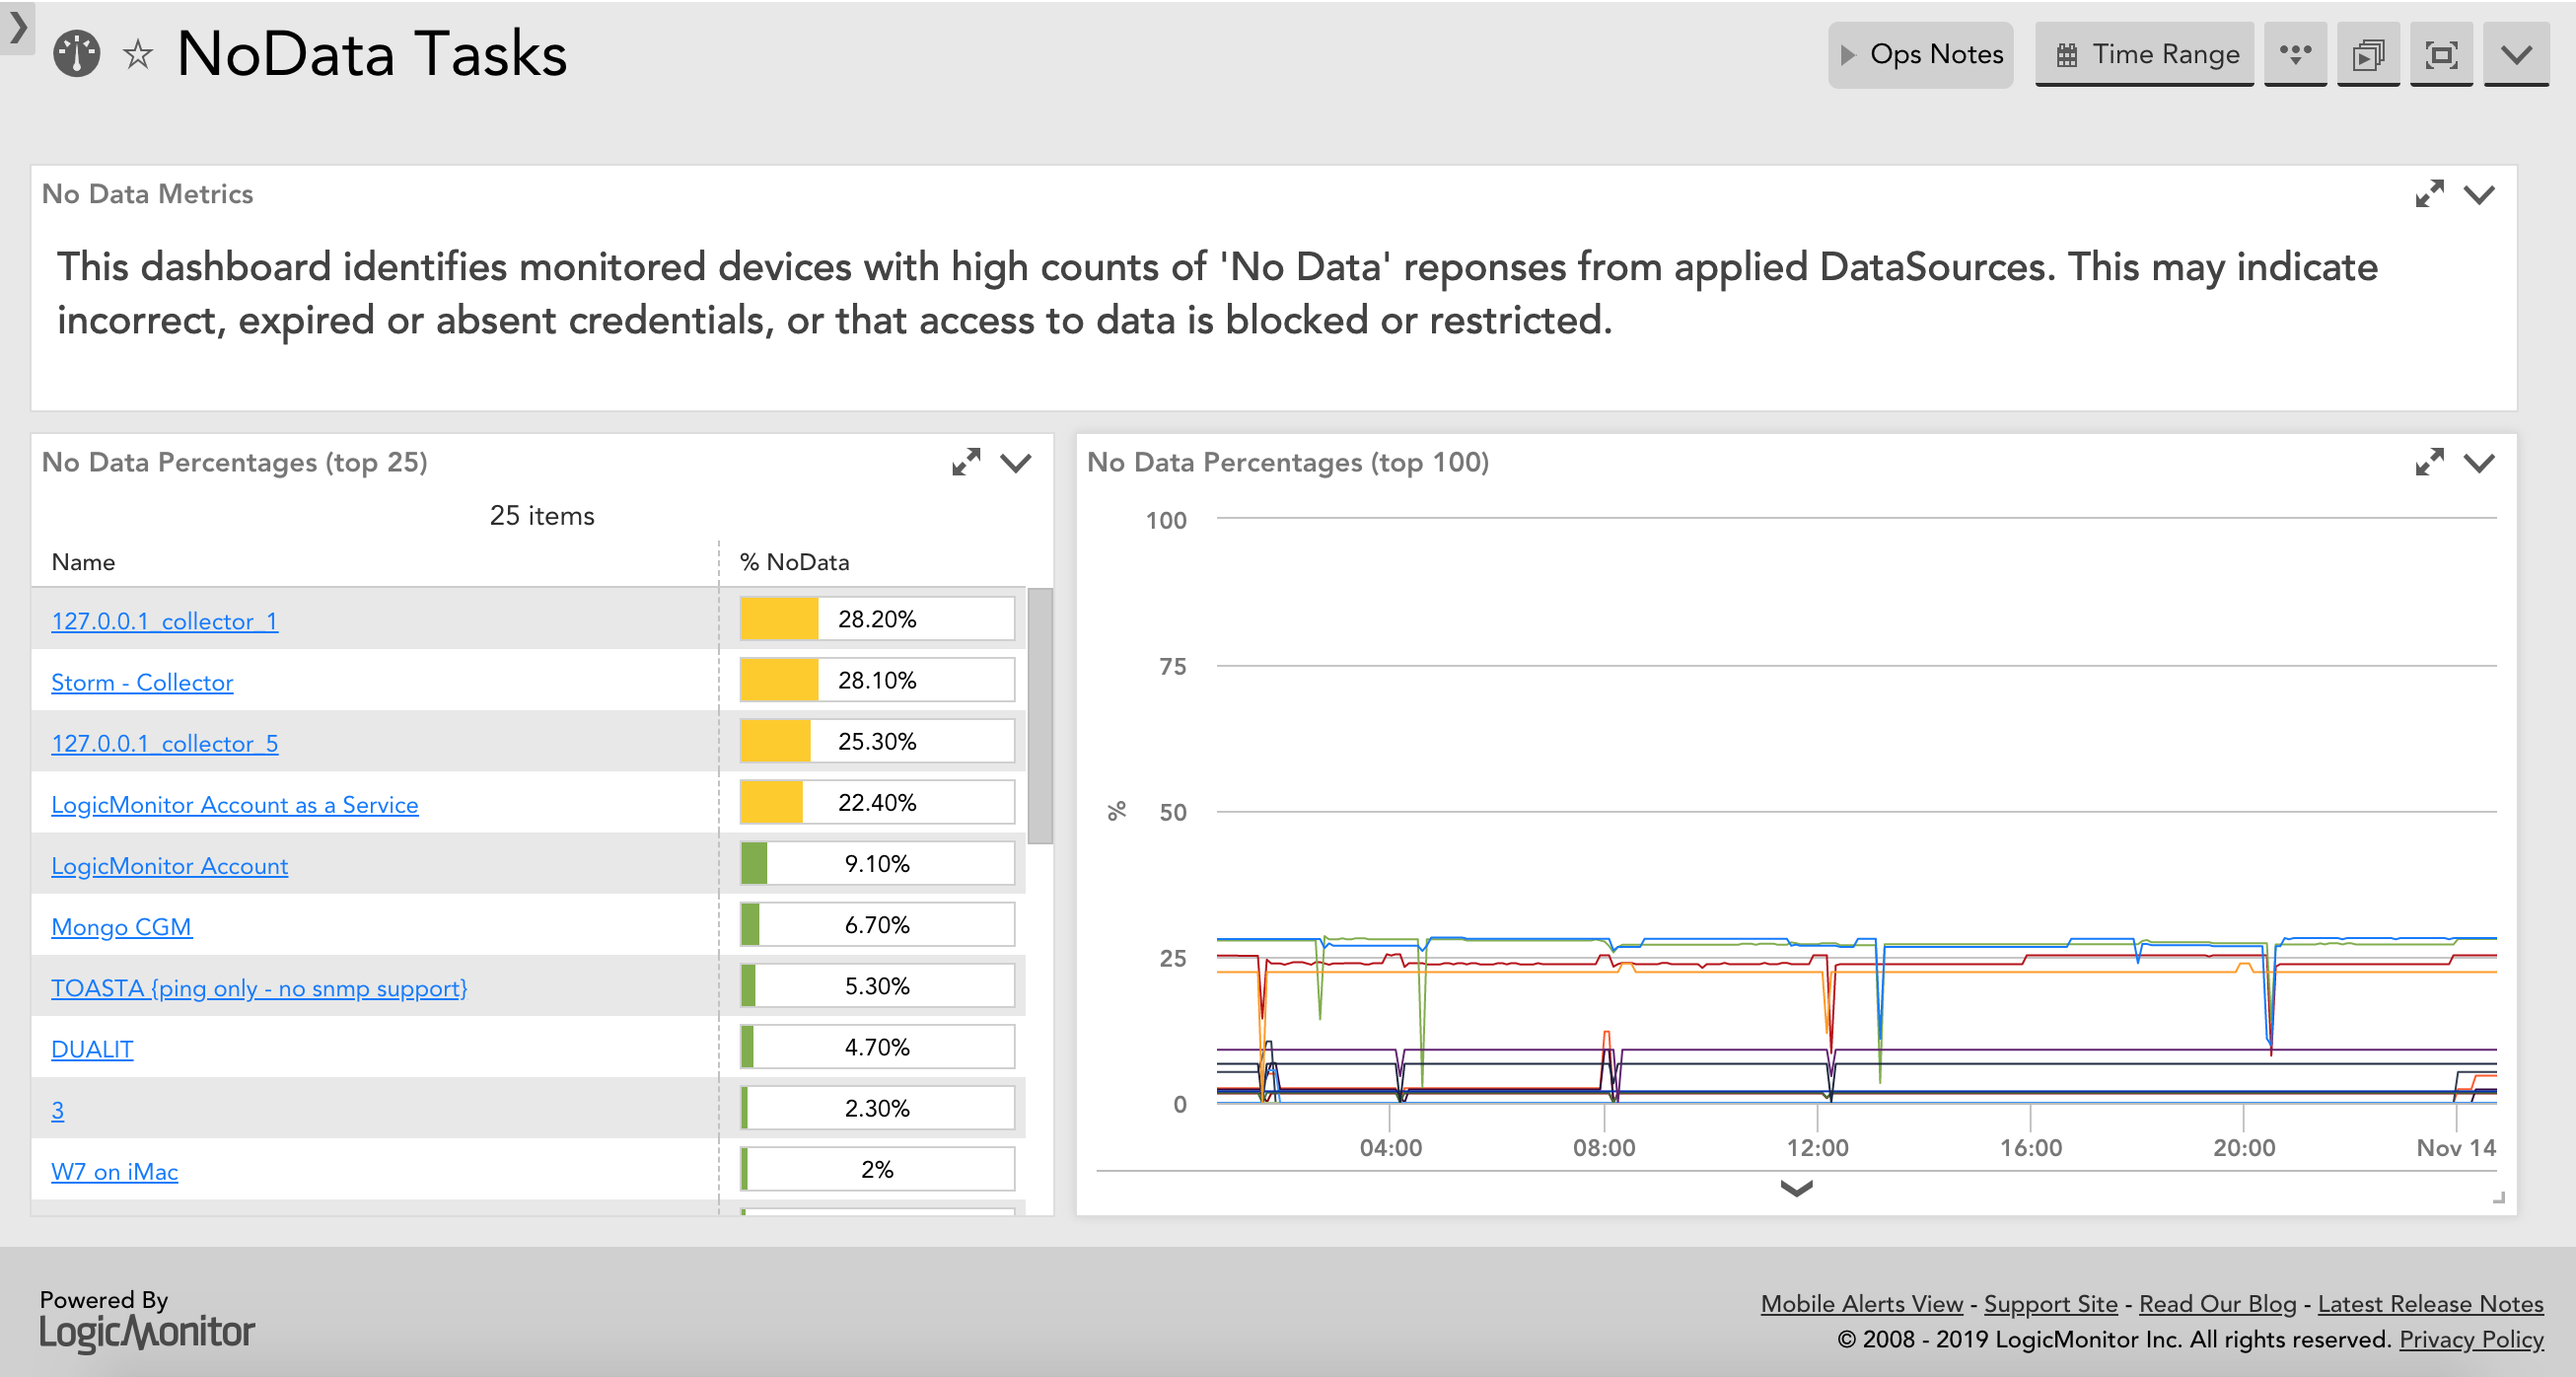
Or for a specific task type on a resource:

Yes, I have a lot of NaN on some of my resources, thanks to years of experimenting. I probably ought to tidy that up, and now I can see where I need to concentrate my efforts...

Antony Hawkins
OP4 years agoSome of 3 years later, I've updated these to do a more detailed !tlist call and therefore provide more / better data.
Because they're substantially different from the originals in terms of datapoints and instance names, I've unimaginatively called them "..._v2". Which confusingly means the modules in Exchange are the v1.x.x versions of "_v2" modules. I know.
I did this so as to not cause problems for people with the originals who might think a v2.x.x version would be a straight upgrade, which it isn't.
PropertySource:
"NoData_Tasks_Discovery_v2": v1.0: FEDEHY
DataSources:
"NoData_Tasks_By_Type_v2": v1.3: 3ZD7RC
"NoData_Tasks_Overall_v2": v1.1: MCPEGK
Key changes on discovery are, EventSource tasks are no longer cared about (actually no point, !tlist doesn't provide meaningful indicators in this context) and ConfigSources are split out (!tlist doesn't differentiate, these are just script collection types), so instance names are simpler.
On collection, there are more metrics, to show if a sudden reduction of No Data counts is just because tasks haven't executed yet, and "Has NaN" is differentiated from "All NaN" - not least because, lots of DataSources regularly return NaN on one or more datapoints, for various legitimate reasons, whereas "All NaN" for a task is definitely a problem.
Overall:
Tasks by type overview:
Tasks for a given type:
As ever, no warranty is given or implied, and if you find these useful, please tell your Customer Success Manager!
Michael Rodrigues
·4 years ago@Garry Gearhart as of now that is correct, yes.
Garry_Gearhart
·4 years agoJust wanted to summarize as of right now there is no SSE based option that provides this information, correct?
Michael Rodrigues
·5 years ago@Stefan W Large collector is:
8GiB total RAM (recommended)
4GiB JVM RAM (configured in agent.conf)
2GiB SSE RAM (half of configured JVM RAM)
So you shouldn't even need 4 GiB for the SSE to start.
The above is only for embedded Groovy scripts. Powershell, upload scripts, and external scripts don't run in the JVM.
We'll improve the capacity document. I appreciate you taking the time to investigate and post your findings.
Stefan Wuensch
·5 years agoFinally I had a chance to look into our Collector sizing and the SSE indeed appears to be not starting on _most_ of our Collectors! You are exactly right!
The odd thing (which I'm still investigating) is that the vast majority of our Collectors are 16GB memory, but deliberately set to "only" Large. I guess we can theorize that more than 4GB is being taken by the OS and other non-Collector components, because otherwise the 4GB SSE would be able to start in addition to the 8GB JVM.
A side note about that doc https://www.logicmonitor.com/support/collectors/collector-overview/collector-capacity The table lists Large Collector SSE Memory Requirements as 2GiB but the text (as you quoted above) says "the SSE requires half of the amount of memory allotted to the JVM". Those seem to be in disagreement. Shouldn't the table list 4GiB for a Large which is 8GiB for JVM? It seems like the values in the table are all half what they should be.
Again no reply needed. This is all just in case it's helpful / useful.
Antony Hawkins
OP5 years agoThanks @Stefan W - I believe this *might* be down to collector resources.
https://www.logicmonitor.com/support/collectors/collector-overview/collector-capacity
'In general, the SSE requires half of the amount of memory allotted to the JVM. The memory requirements are not shared, rather the SSE requirement is in addition to the JVM memory requirements. If the Collector does not have this memory available, the SSE will not start and you will see “Can’t find the SSE Collector Group” in the Collector Status dialog. The Collector will work without the SSE, but Groovy scripts will be executed from the Agent instead of the SSE.'
My first guess is that those collectors responsible for the working metrics are starting without the SSE, for this reason.
Stefan Wuensch
·5 years agoIt sounds like these NoData modules are not 100% broken (or at least not broken 100% of the time) by the newer Collector versions. I'm seeing exactly that in our portal, where - for no reason that I can find - we are back up to 177 Devices with the NoData DS Instances. It's surprising because all our Collectors are either 30.001 or 30.102. No reply nor action needed on our behalf. I'm just mentioning this in case you want to see in our portal what's allowing the NoData monitoring to work again for those Devices.
Michael Rodrigues
·5 years agoWe're investigating how to properly support this use case going forward. We appreciate the patience and understanding in the meantime.
Antony Hawkins
OP5 years agoFYI, Collector GD30.000 (and EA29.1xx+) breaks these modules as execution of PropertySource scripts and others are moved to the SSE (Standalone Script Engine), which does not currently support the method used here.
The workaround is to disable the use of SSE (not recommended, the SSE exists for a reason!).
If you're using these and now they're producing a bunch of NaN (ironically...) and flatline zeros, please log a feature request / contact your CSM for same.
When / if I get some free time I will go back and see if I can do something similar via a different method.
LM User
·5 years agoI doubt this will be incorporated into the core set of Datasources. You can submit feedback through your portal that this be built into the core set though.
Dominique
·5 years agoThis is excellent! thanks a lot.
I also look for a Widget/Dashboard listing all the Devices having at least one NaN displayed in their tree...
Also will this included in the Logic Monitor product itself as there is a string block to pass before importing community (even by LM Engineer) Datasources, PropertySources...
Thanks,
Dom
Antony Hawkins
OP6 years agoNB. Dynamic Thresholds v2 is the next major step in this "puzzle", as it now gives the ability to learn how many tasks and how many NaN tasks normally exist on a resource; this means you no longer need to set a threshold on e.g. X% NaN tasks, nor alert immediately on a change.
You can (with DTv2) learn normal for both and therefore alert on changes that indicate a credential or protocol connectivity change, a resource becoming unresponsive, or an Active Discovery run adding or removing large numbers of instances.
Vitor_Santos
·6 years agoThis is very useful!
Thanks for the efforts on this!
Darren_Dudgeon
·6 years agoAntony,
Thanks for sharing this - we need this functionality so i was happy to find this.
Unfortunately when i try to import the Discovery Property Source i get a warning and i cannot proceed. The warning is "LogicModule (type=property_rule) was not found". And it seems the Data Sources rely on the Property Source.
Darren.
drazzopardi
·6 years agoHi Antony
Finally got my hands on this. Looking good!!
Thanks for the efforts and letting me know about it
David